Fig. 13
Download original image
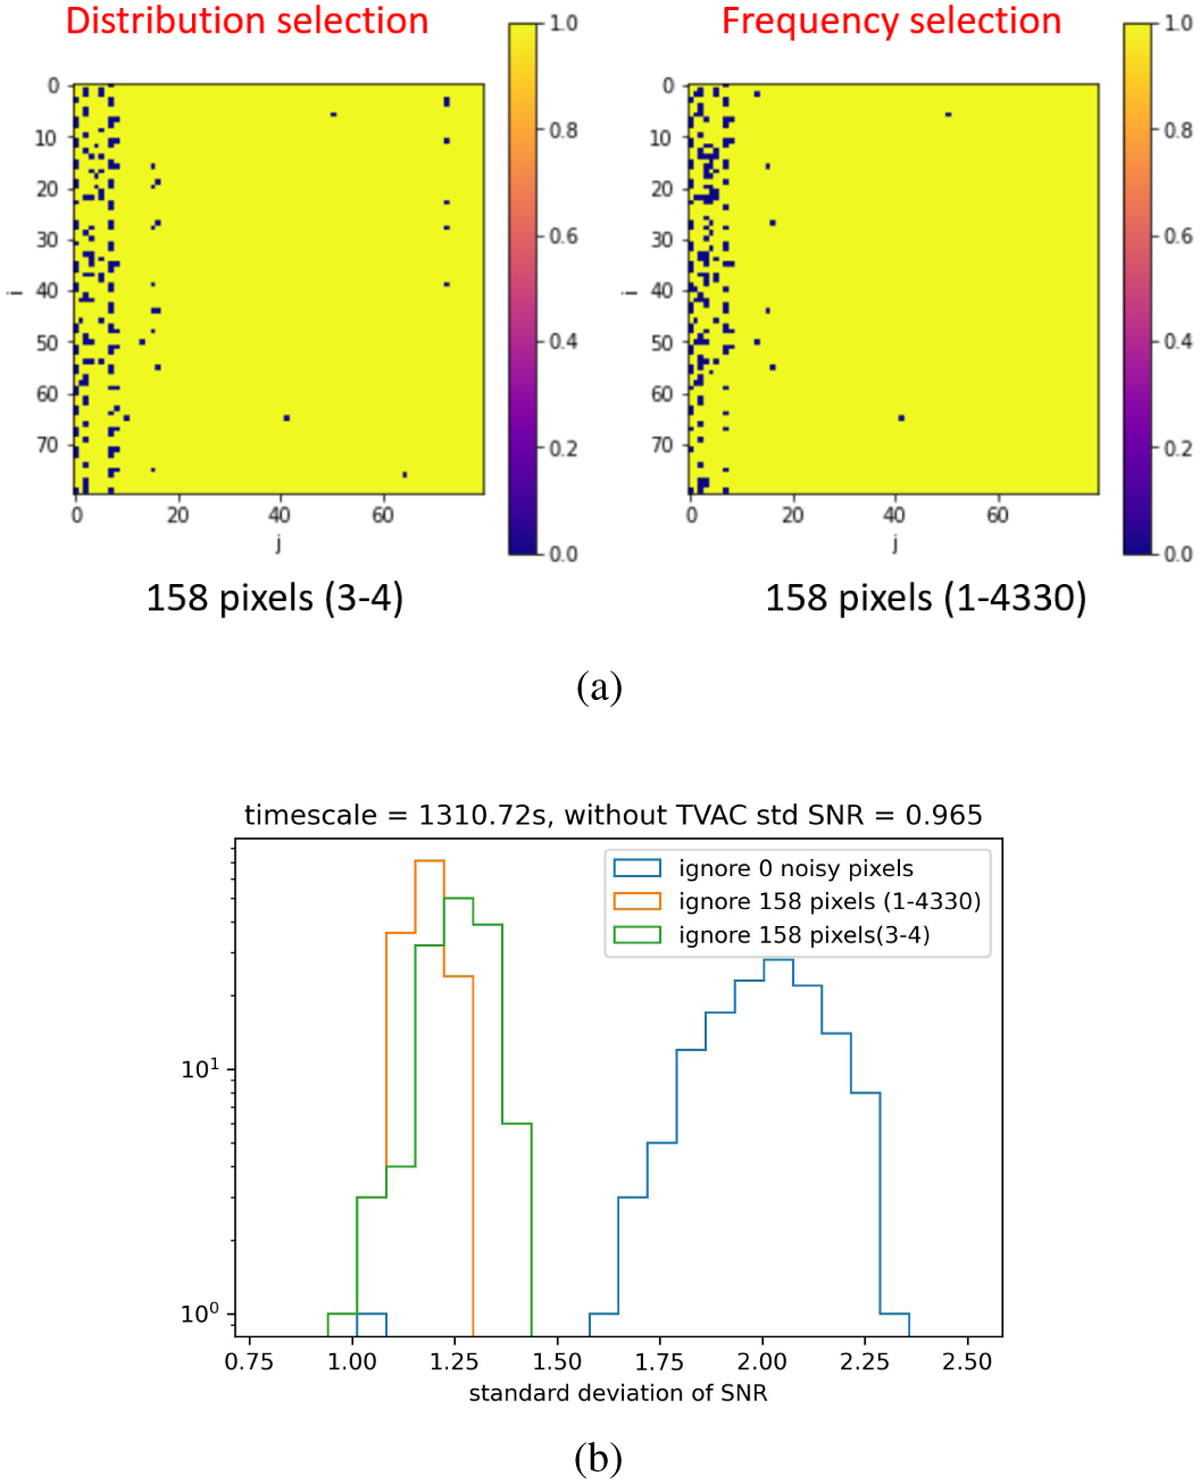
Selected noisy pixel tables and the simulation result after ignoring the selected noisy pixels. (a) Example of 158 heat-pipe noise pixels (black pixels, 2.5% of the total number) selected through the two selection methods (distribution and frequency selection). (b) Histogram of the σS/N in the 4-8 keV band for the 1310 s timescale after using the different selection methods. The blue histogram shows the result without correction for the heat-pipe noise. (the mean value is about 2, which means that the trigger threshold would have to be increased by a factor of 2 to avoid false triggers). The frequency selection method is shown in green and the distribution selection method is shown in orange (after those corrections, the trigger thresholds need to be increased only slightly compared to the ideal case without heat-pipe noise).
Current usage metrics show cumulative count of Article Views (full-text article views including HTML views, PDF and ePub downloads, according to the available data) and Abstracts Views on Vision4Press platform.
Data correspond to usage on the plateform after 2015. The current usage metrics is available 48-96 hours after online publication and is updated daily on week days.
Initial download of the metrics may take a while.