Open Access
Fig. 11
Download original image
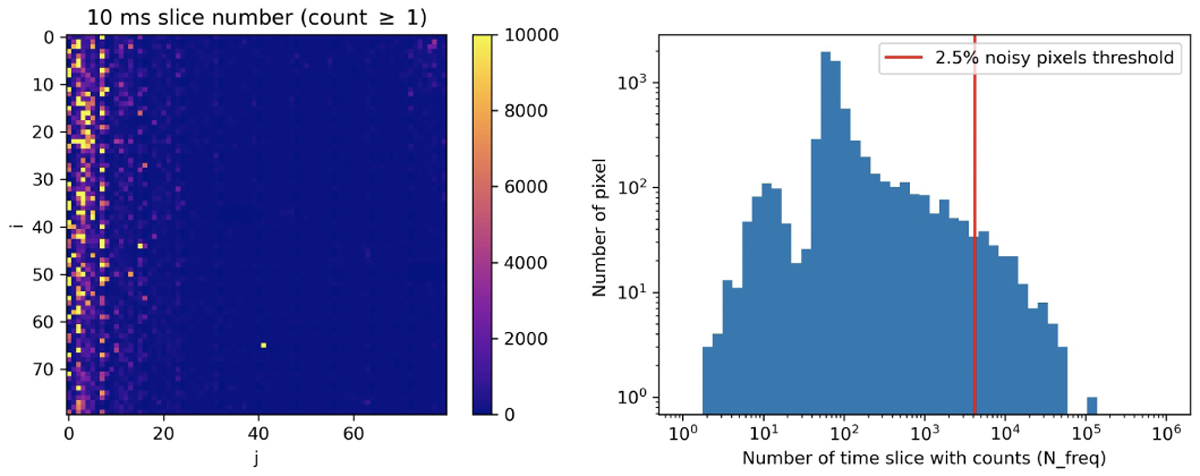
Frequency selection method. Left: 10 ms slice number (Nfreq) distribution of pixels with a count ≥1 in the detection plane. Right: histogram of Nfreq for 6400 pixels corresponding to the left figure. The red line is the threshold of Nfreq for selecting 2.5% noisy pixels.
Current usage metrics show cumulative count of Article Views (full-text article views including HTML views, PDF and ePub downloads, according to the available data) and Abstracts Views on Vision4Press platform.
Data correspond to usage on the plateform after 2015. The current usage metrics is available 48-96 hours after online publication and is updated daily on week days.
Initial download of the metrics may take a while.