Fig. 10
Download original image
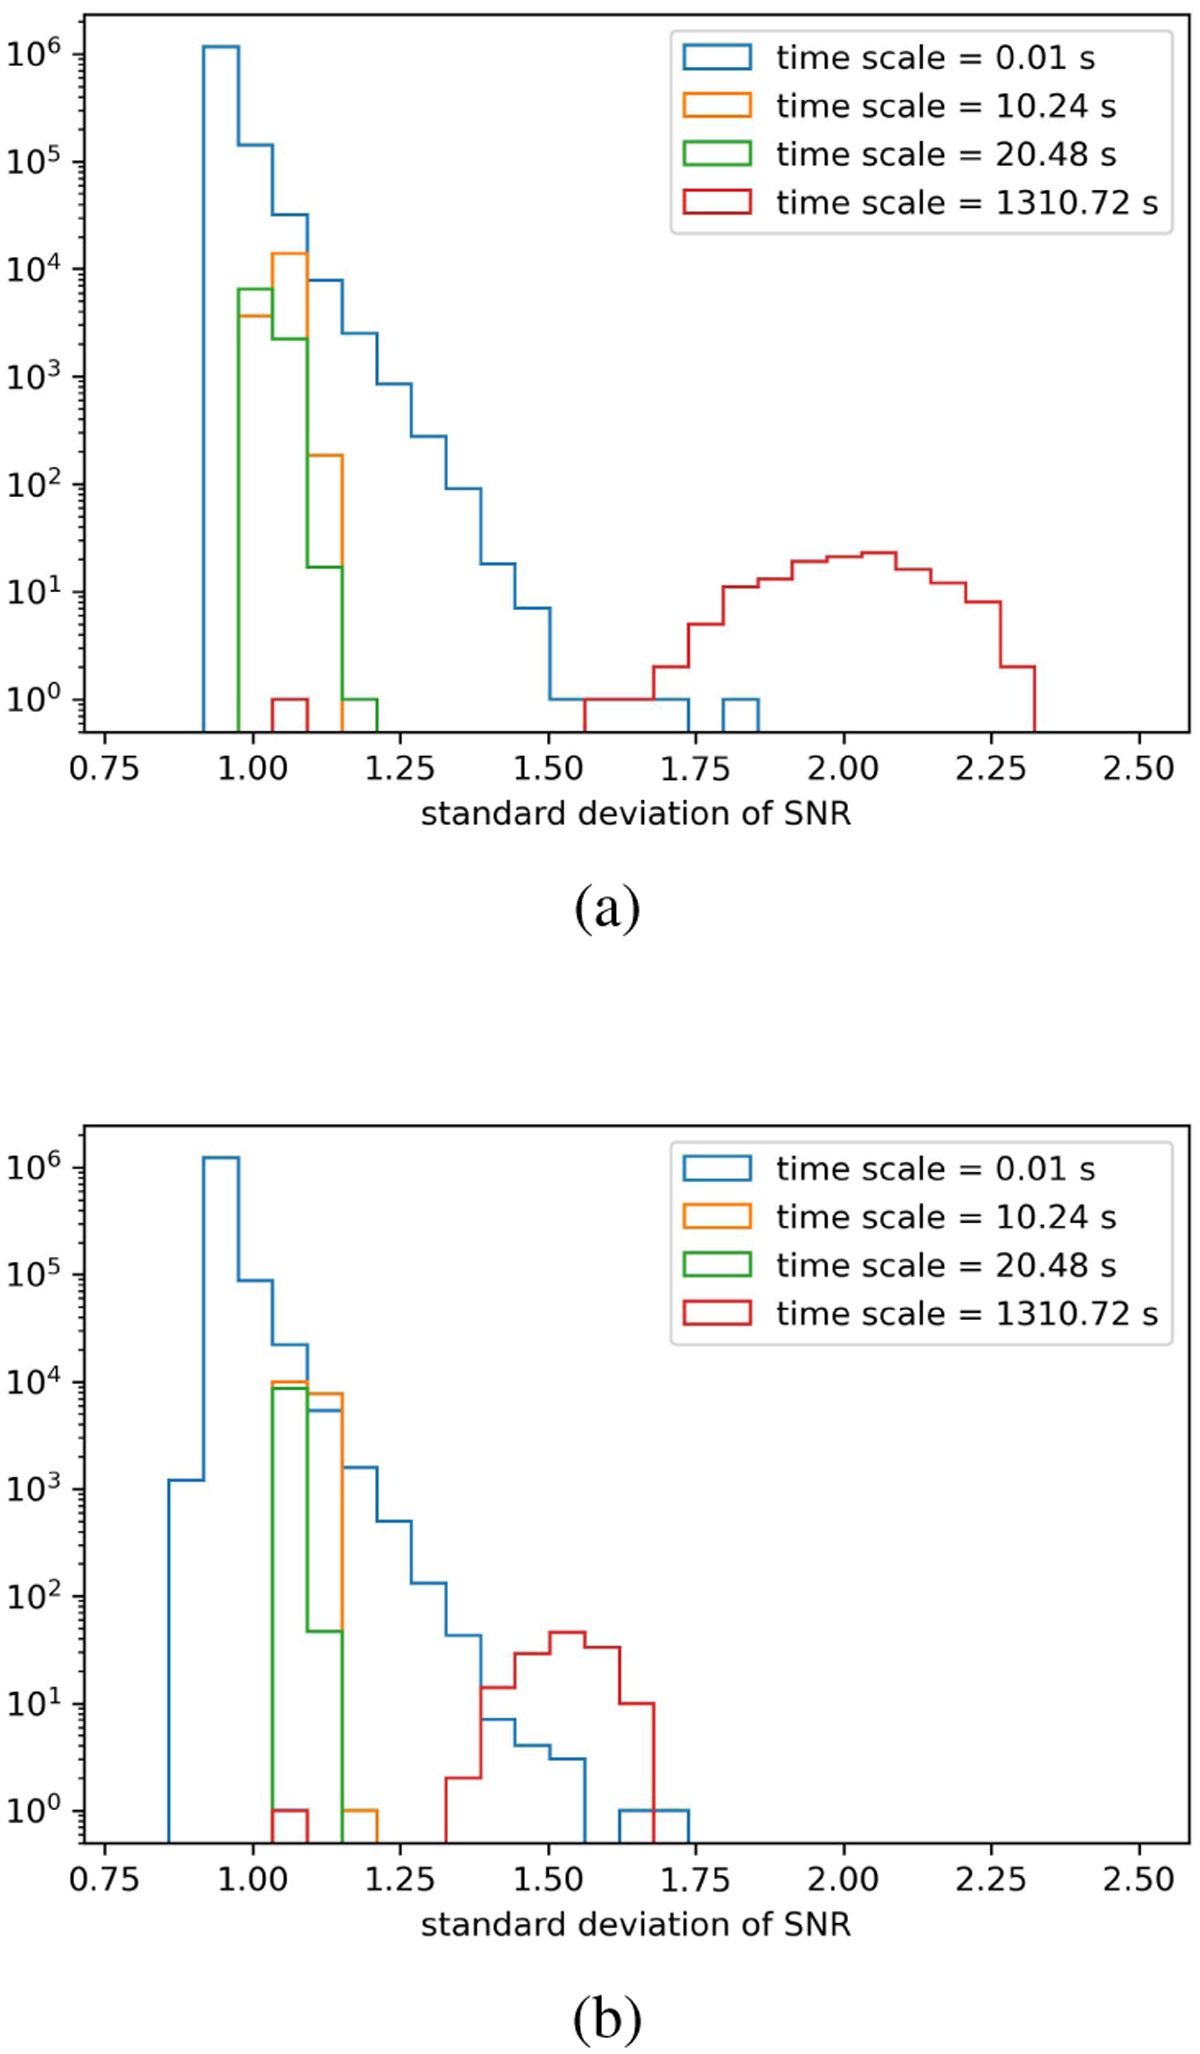
Histograms of σS/N of all deconvolved sky maps (repeating the procedure of Fig. 9) obtained with all TVAC data (background-only periods without an X-ray source) overlaid with simulated CXB counts in the 4–8 keV band (a) and in the 4–120 keV band (b) for different timescales of 0.01 s, 10.24 s, 20.48 s, and 1310.72 s. We divided the TVAC data into intervals with a duration that was fixed to the timescales described above, among which we selected only intervals with at least one count (removing zero-count images mostly for the short-duration timescales). The resulting numbers of data points in the histograms are 1 340 000, 17 660, 8745, and 135 for the timescales we used.
Current usage metrics show cumulative count of Article Views (full-text article views including HTML views, PDF and ePub downloads, according to the available data) and Abstracts Views on Vision4Press platform.
Data correspond to usage on the plateform after 2015. The current usage metrics is available 48-96 hours after online publication and is updated daily on week days.
Initial download of the metrics may take a while.