Fig. A.1.
Download original image
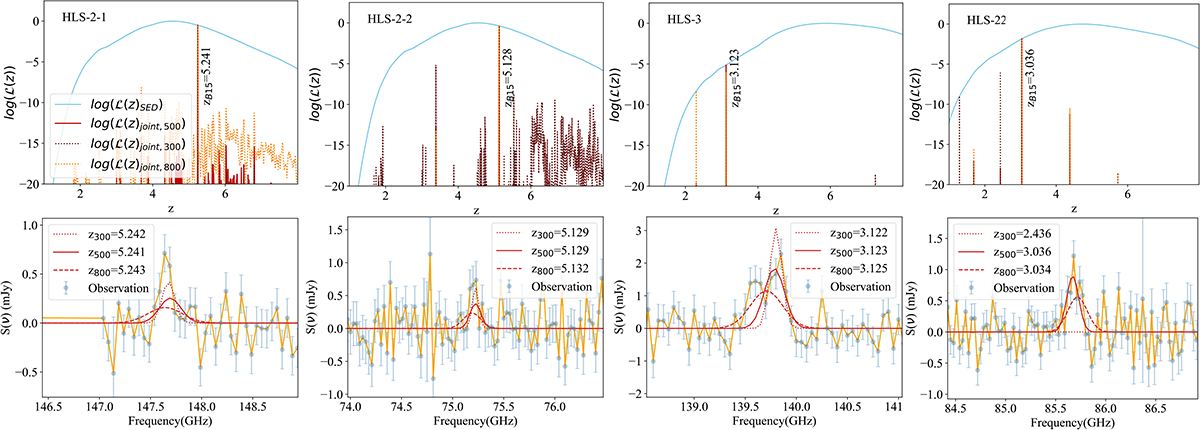
The output and comparison between the results of joint redshift analysis under different assumptions of line width. Upper row: Joint log-likelihood of the four HLS sources with model spectra with line widths of 300km/s, 500km/s, and 800km/s. Lower row: Comparison of the models of these the line widths at the corresponding redshift solution and the observed source spectra.
Current usage metrics show cumulative count of Article Views (full-text article views including HTML views, PDF and ePub downloads, according to the available data) and Abstracts Views on Vision4Press platform.
Data correspond to usage on the plateform after 2015. The current usage metrics is available 48-96 hours after online publication and is updated daily on week days.
Initial download of the metrics may take a while.