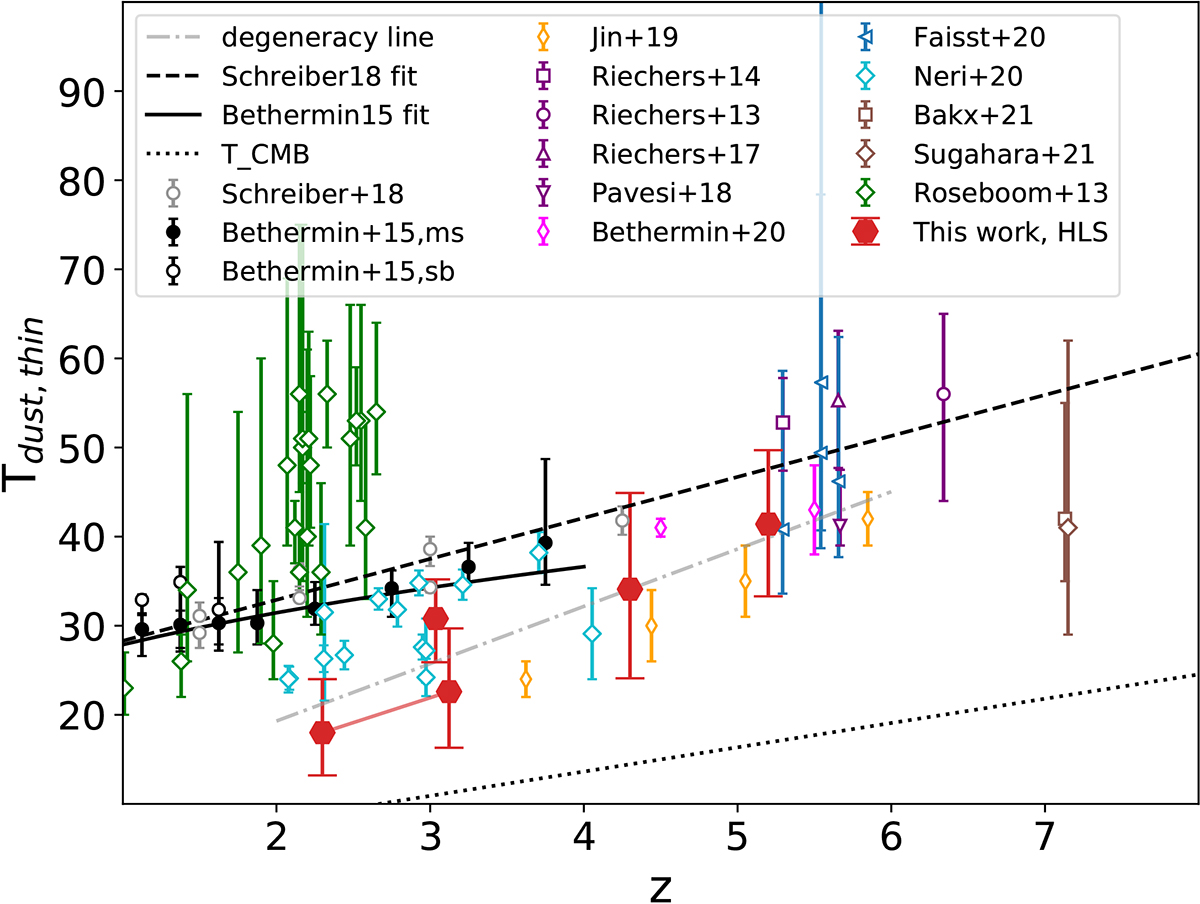
Fig. 7.
Download original image
Dust temperature vs. redshift of the high-z DSFGs in our sample, and DSFGs or LBGs from the literature. The dust temperatures of these sources are all measured with the optically thin modified blackbody model. The corresponding references are listed in the legend. We also overlaid the average Tdust-z relation of main-sequence galaxies derived by Schreiber et al. (2018) and Béthermin et al. (2015a) based on observational data. For HLS-4 with a photometric redshift alone, we show the degeneracy between dust temperature and redshift with the dash-dotted gray line. The Tdust of HLS-3 at the two possible redshifts is plotted and connected by the solid red line.
Current usage metrics show cumulative count of Article Views (full-text article views including HTML views, PDF and ePub downloads, according to the available data) and Abstracts Views on Vision4Press platform.
Data correspond to usage on the plateform after 2015. The current usage metrics is available 48-96 hours after online publication and is updated daily on week days.
Initial download of the metrics may take a while.