Open Access
Fig. 5.
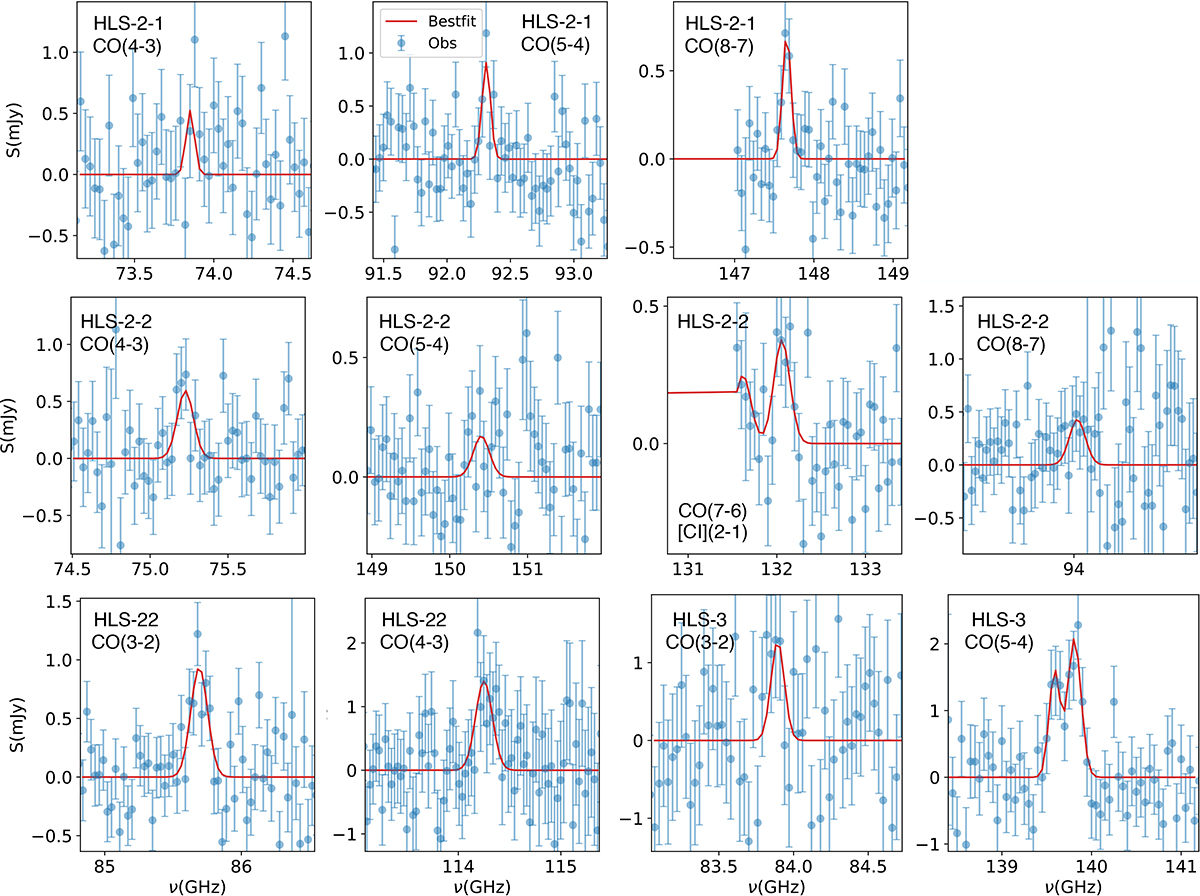
Download original image
Observations and best fits of the spectral lines, including both detections and upper limits. The best-fit model of each line is shown with the solid red line. For HLS-3, we show the two lines assuming z = 3.123.
Current usage metrics show cumulative count of Article Views (full-text article views including HTML views, PDF and ePub downloads, according to the available data) and Abstracts Views on Vision4Press platform.
Data correspond to usage on the plateform after 2015. The current usage metrics is available 48-96 hours after online publication and is updated daily on week days.
Initial download of the metrics may take a while.