Fig. 4.
Download original image
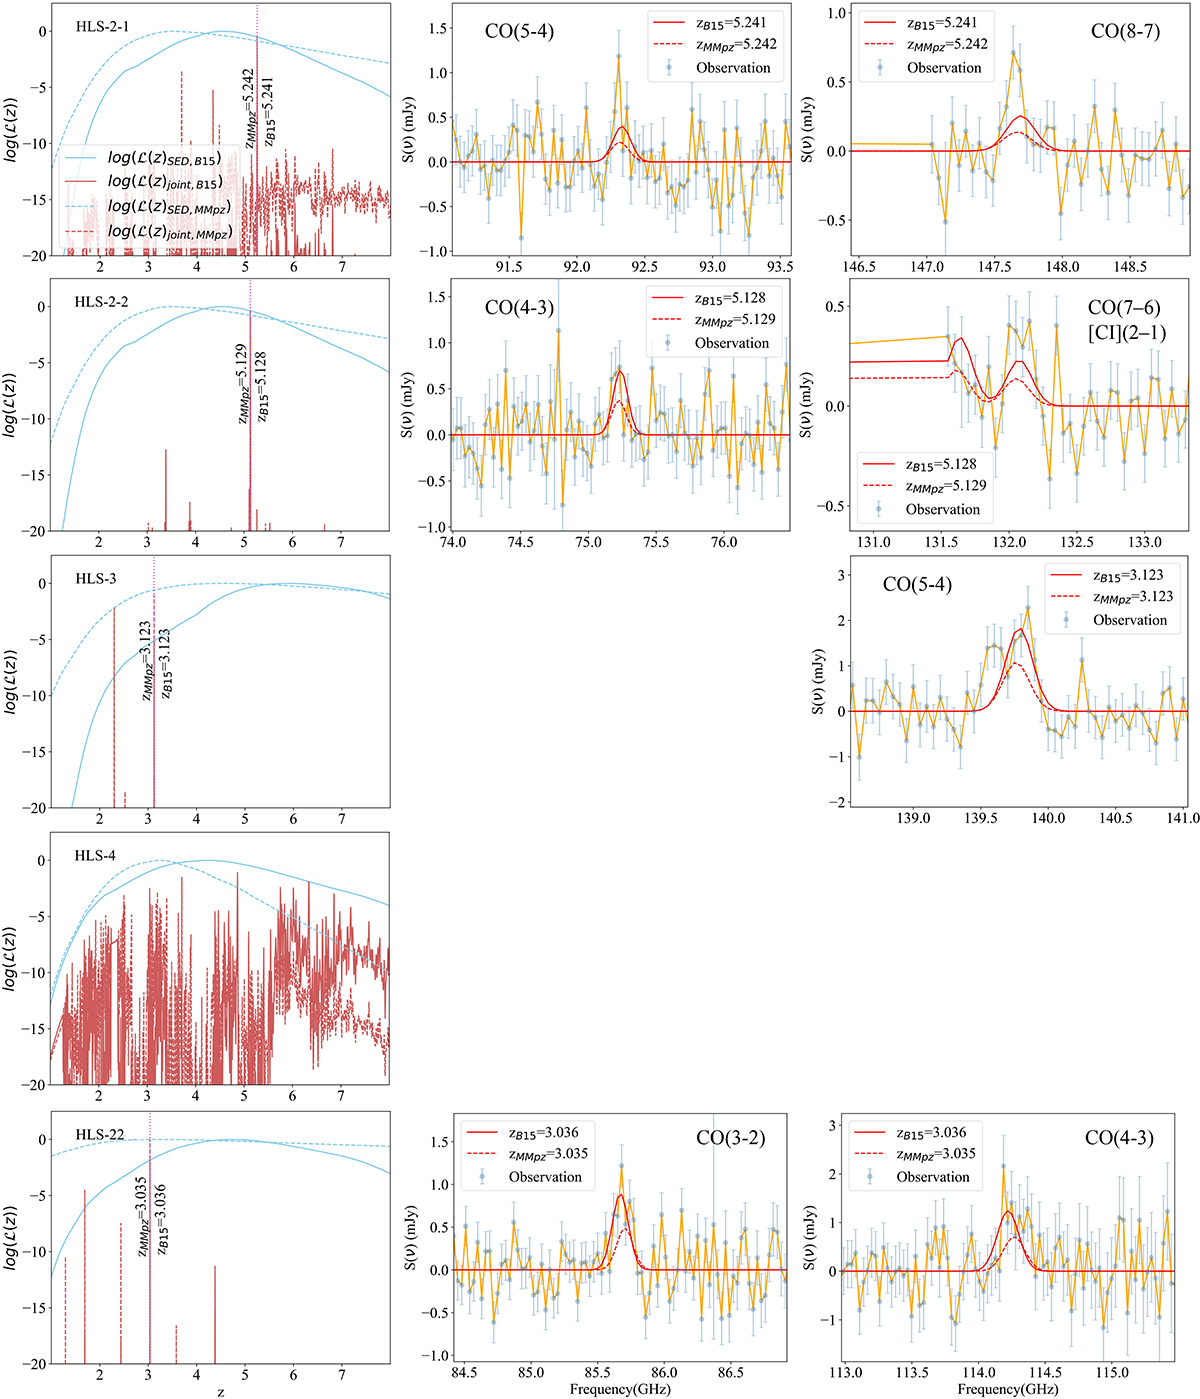
Joint analysis of the redshift for four NIKA2 HLS sources with the SED-fitting outputs using the B15 dust templates and MMPZ. The first row shows the normalized log-likelihood from the SED fitting and the joint log-likelihood for each source after considering the information obtained from the NOEMA spectral scans. The second and third row show the cutouts of the spectra around candidate spectral lines at the best redshift solutions. The lines shown in the second row are detected in the earliest band1 spectral scans (W17EL and W17FA), and those in the third row are detected in the additional follow-up observations (W18FA and S20CL). The models generated based on the fit with the B15 dust templates and MMPZ at the most probable redshift are plotted as solid and dashed red lines, respectively.
Current usage metrics show cumulative count of Article Views (full-text article views including HTML views, PDF and ePub downloads, according to the available data) and Abstracts Views on Vision4Press platform.
Data correspond to usage on the plateform after 2015. The current usage metrics is available 48-96 hours after online publication and is updated daily on week days.
Initial download of the metrics may take a while.