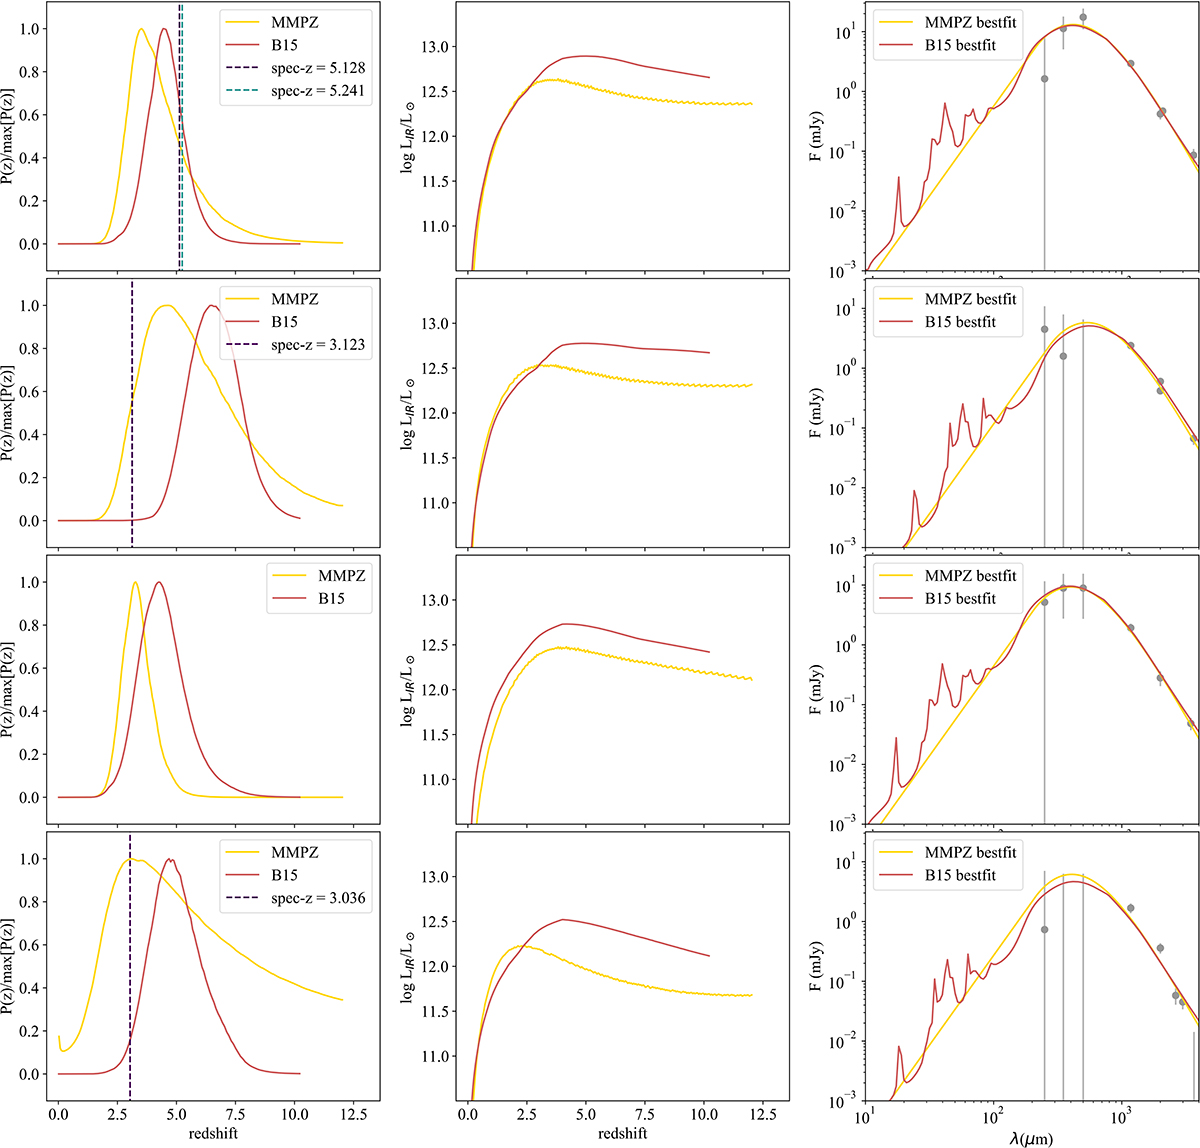
Fig. 3.
Download original image
Results of the IR template fitting of our four HLS sources with the B15 dust templates and MMPZ method using the SPIRE, NIKA2, and NOEMA photometry. The plots in the first column show the probability density distribution (normalized by the peak values) of each source. The second column shows the evolution of the weighted-average infrared luminosity with redshift. The third column shows the best-fit SED models with the observations. The sources from top to bottom are HLS-2, HLS-3, HLS-4, and HLS-22.
Current usage metrics show cumulative count of Article Views (full-text article views including HTML views, PDF and ePub downloads, according to the available data) and Abstracts Views on Vision4Press platform.
Data correspond to usage on the plateform after 2015. The current usage metrics is available 48-96 hours after online publication and is updated daily on week days.
Initial download of the metrics may take a while.