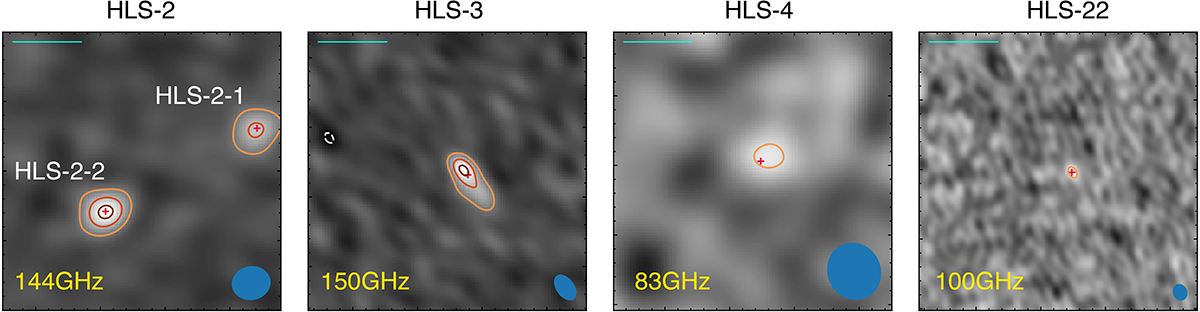
Fig. 1.
Download original image
Cleaned images of the NOEMA observation for our four NIKA2 sources. The effective beam size and shape of each map is shown in the bottom right corner of each panel. The contour levels from orange to dark red correspond to −4, 4, 8, and 12 times the rms of each map, respectively. The red crosses mark the position of detected NOEMA sources from the uv_fit. The two resolved sources associated with HLS-2 are also labeled separately (HLS-2-1 and HLS-2-2). The scale bars in the maps (upper left) correspond to 5 arcsec in the sky. The frequency of the continuum data is given in the lower left corner of each panel.
Current usage metrics show cumulative count of Article Views (full-text article views including HTML views, PDF and ePub downloads, according to the available data) and Abstracts Views on Vision4Press platform.
Data correspond to usage on the plateform after 2015. The current usage metrics is available 48-96 hours after online publication and is updated daily on week days.
Initial download of the metrics may take a while.