Open Access
Fig. 9
Download original image
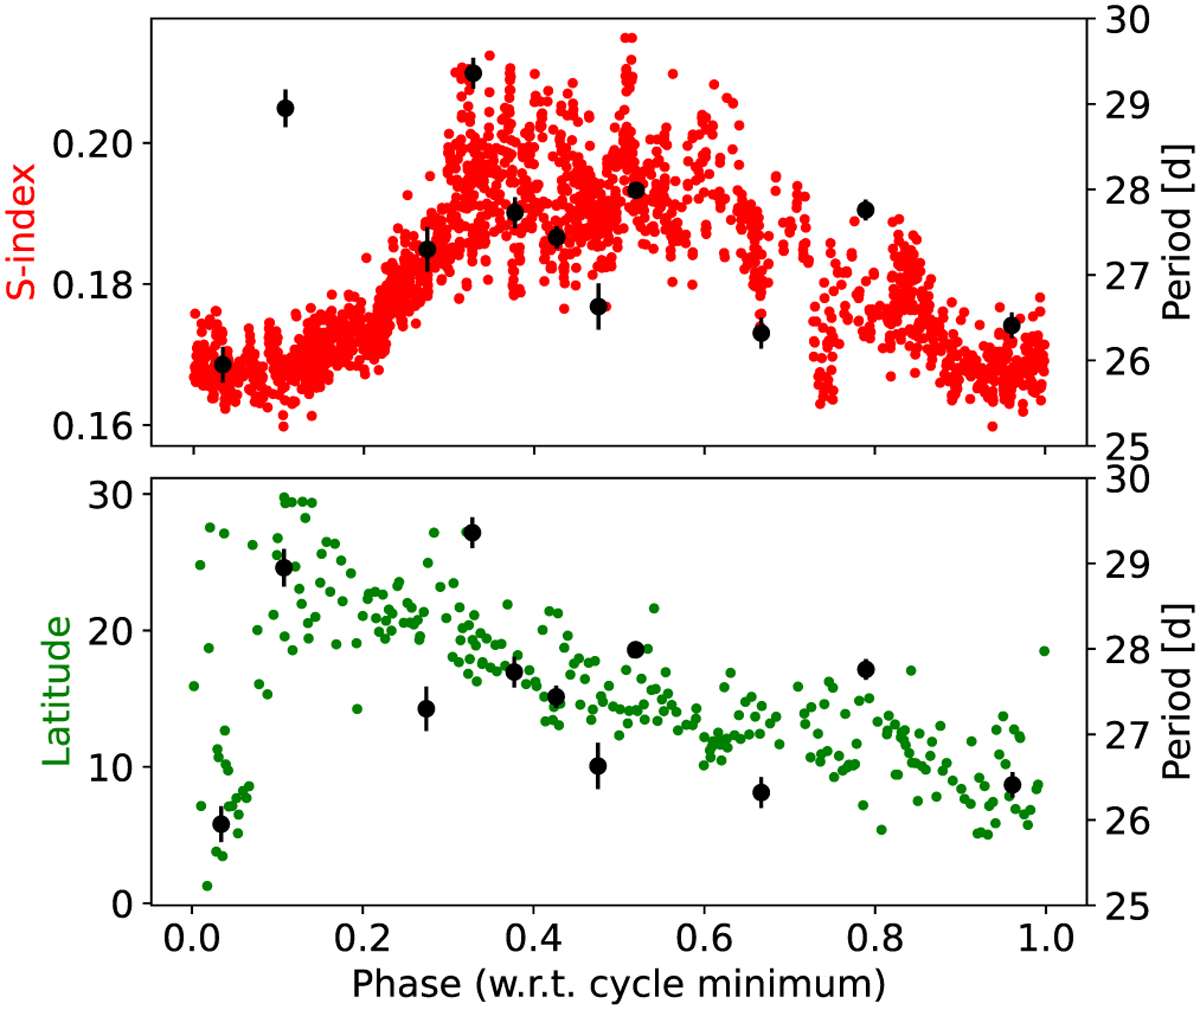
Upper panel: phase-folded S-values (red dots) vs. cycle phase and rotation periods (black circles) vs. cycle phase. Lower panel: phase-folded latitude from 1973 to 1993 (green dots) vs. cycle phase and rotation periods (black circles) vs. cycle phase.
Current usage metrics show cumulative count of Article Views (full-text article views including HTML views, PDF and ePub downloads, according to the available data) and Abstracts Views on Vision4Press platform.
Data correspond to usage on the plateform after 2015. The current usage metrics is available 48-96 hours after online publication and is updated daily on week days.
Initial download of the metrics may take a while.