Fig. 5
Download original image
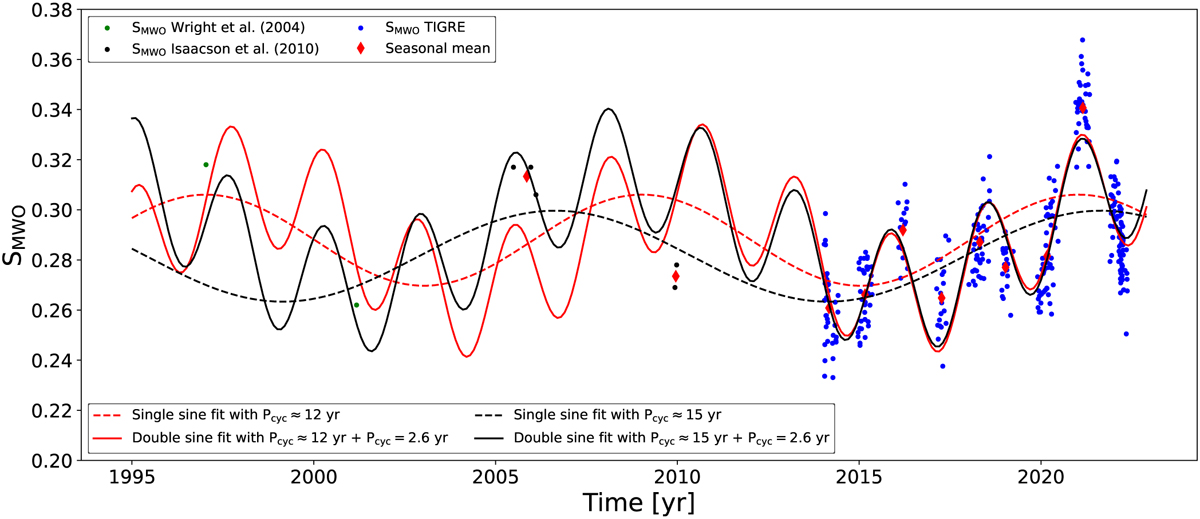
Extended SMWO time series. The green point originates from the Wright et al. (2004) catalogue, the black points are from the Isaacson & Fischer (2010) catalogue, the blue points are TIGRE SMWO values, and the red diamonds represent the observational seasonal mean SMWO values. The dashed lines depict a sine fit with a period of 12 yr (dashed red line) and 15 yr (dashed black line). The solid lines depict double sine fits (the colour-code is the same as for the single sine fits), where the short-term cycle period of 2.6 yr is also considered.
Current usage metrics show cumulative count of Article Views (full-text article views including HTML views, PDF and ePub downloads, according to the available data) and Abstracts Views on Vision4Press platform.
Data correspond to usage on the plateform after 2015. The current usage metrics is available 48-96 hours after online publication and is updated daily on week days.
Initial download of the metrics may take a while.