Open Access
Fig. 1
Download original image
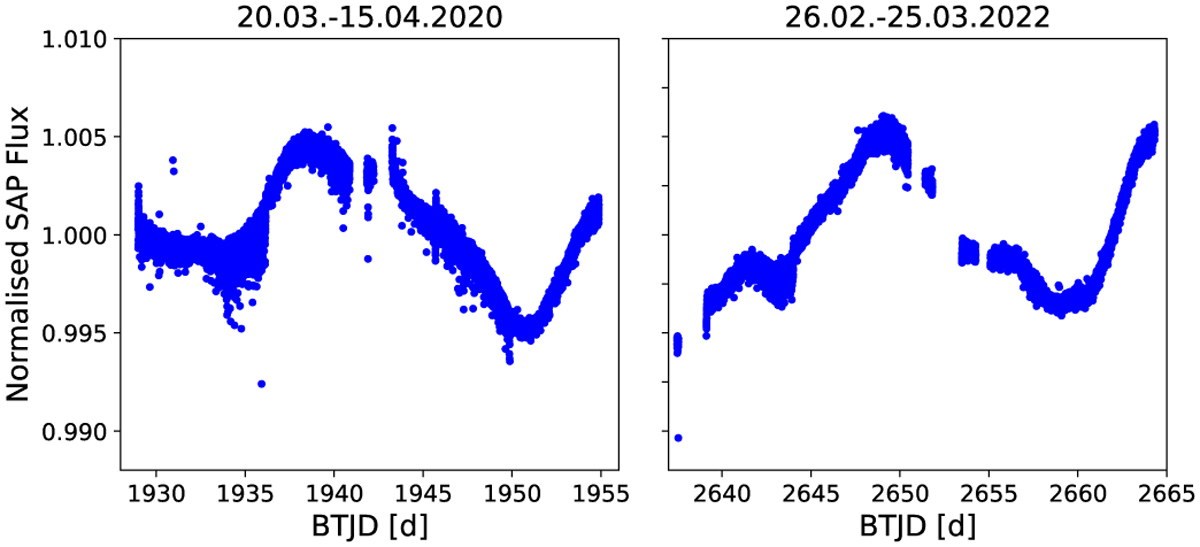
Normalised TESS light curves. The left panel shows the light curve taken in 2020 from March 20 to April 15, and the right panel shows the light curve taken in 2022 from February 26 to March 25.
Current usage metrics show cumulative count of Article Views (full-text article views including HTML views, PDF and ePub downloads, according to the available data) and Abstracts Views on Vision4Press platform.
Data correspond to usage on the plateform after 2015. The current usage metrics is available 48-96 hours after online publication and is updated daily on week days.
Initial download of the metrics may take a while.