Fig. 9
Download original image
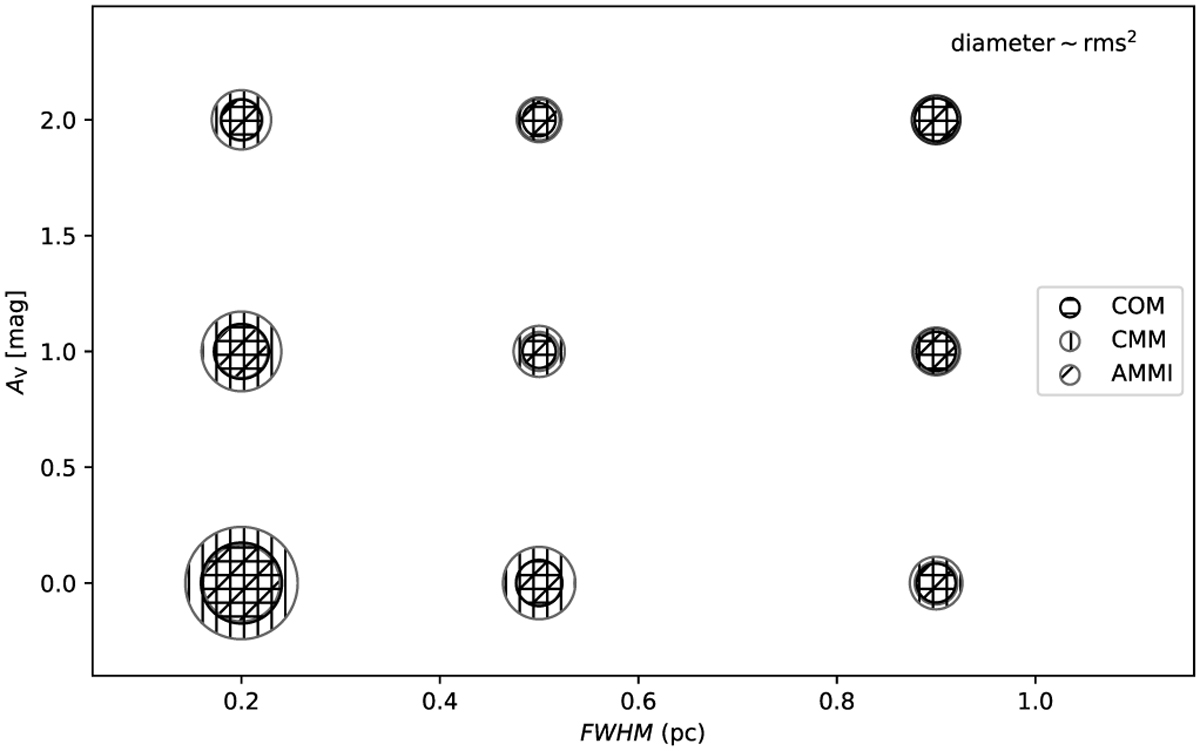
Relative rms error for the model fits using the COM, CMM, and AMMI dust models. Errors are plotted against the FWHM (x-axis) and AV (y-axis) parameters. The data correspond to region C (cſ. Fig. 1). The diameter of the symbols is proportional to the squared error. Models with larger LOS extent and/or more extincted radiation fields tend to result in better fits.
Current usage metrics show cumulative count of Article Views (full-text article views including HTML views, PDF and ePub downloads, according to the available data) and Abstracts Views on Vision4Press platform.
Data correspond to usage on the plateform after 2015. The current usage metrics is available 48-96 hours after online publication and is updated daily on week days.
Initial download of the metrics may take a while.