Fig. 7
Download original image
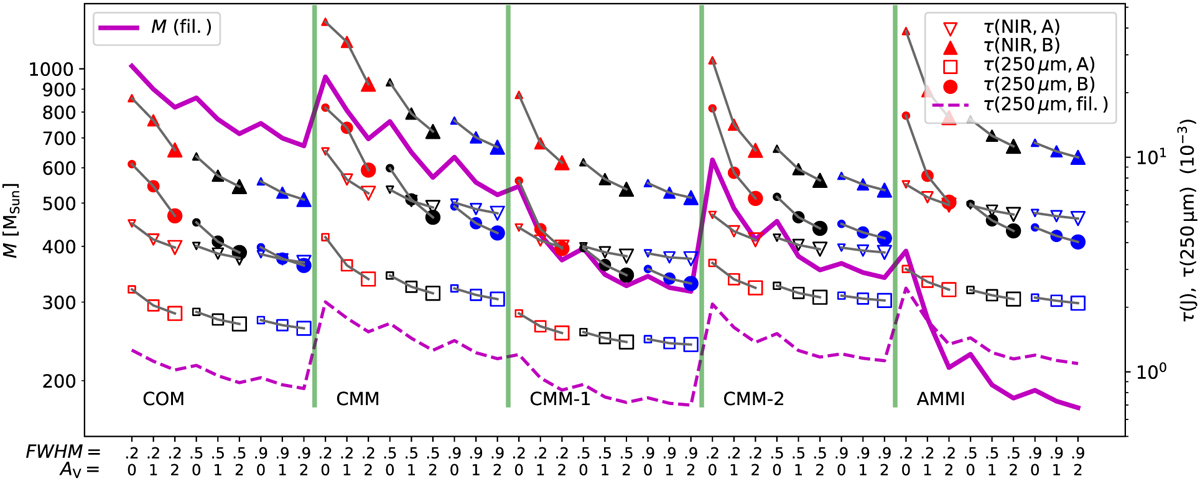
Mass and optical depth values in selected RT models. The solid magenta line and the left axis show the estimated mass for the filament area, and the dashed magenta line and the right axis the corresponding mean optical depth τ(250 µm). The symbols show the J-band (triangles) and 250 µm (squares) optical depths (right axis) for the positions A (open symbols) and B (filled symbols). The red, black, and blue colours correspond to FWHM = 0.2, 0.5, and 0.9pc, respectively, and the small, medium, and large symbols to AV = 0, 1, and 2mag. The x-axis is also labelled according to the FWHM and AV values of the models.
Current usage metrics show cumulative count of Article Views (full-text article views including HTML views, PDF and ePub downloads, according to the available data) and Abstracts Views on Vision4Press platform.
Data correspond to usage on the plateform after 2015. The current usage metrics is available 48-96 hours after online publication and is updated daily on week days.
Initial download of the metrics may take a while.