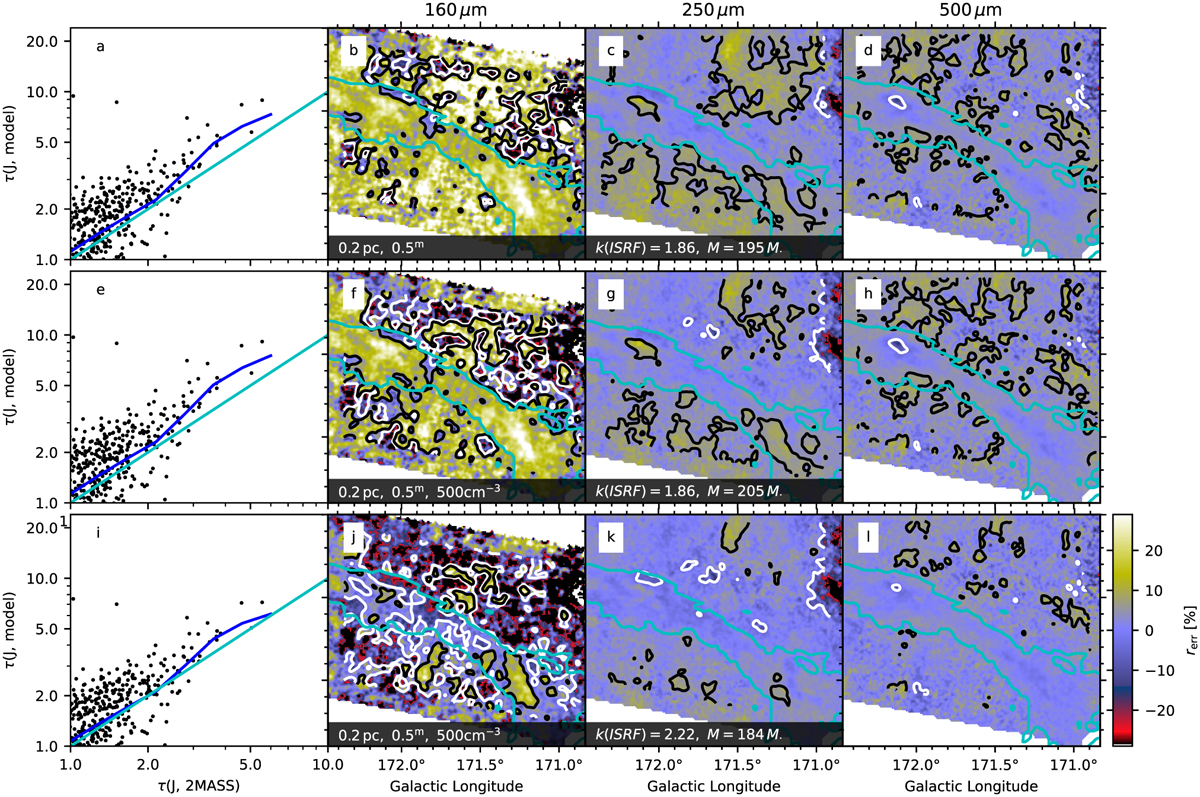
Fig. 21
Download original image
Fits employing dust with large FIR emissivity. The left-most frames plot the model-predicted τ(J) against the observed values. The other frames show fit residuals at 160 μm, 250 μm, and 500 μm, where the −5% and +5% error levels are indicated with white and black contours, respectively. The first row shows results for a model with CMM-3 dust, and the second row for a model using a combination of COM and CMM-3. The model on the bottom row also uses two dust components, where CMM-3 is replaced with one with a lower FIR opacity (twice the value in CMM) and a lower spectral index (β ~ 1.7). The model FWHM, AV, and n0 values are listed in the second and the k(ISRF) and mass estimates of the filament region in the third frame column.
Current usage metrics show cumulative count of Article Views (full-text article views including HTML views, PDF and ePub downloads, according to the available data) and Abstracts Views on Vision4Press platform.
Data correspond to usage on the plateform after 2015. The current usage metrics is available 48-96 hours after online publication and is updated daily on week days.
Initial download of the metrics may take a while.