Fig. 20
Download original image
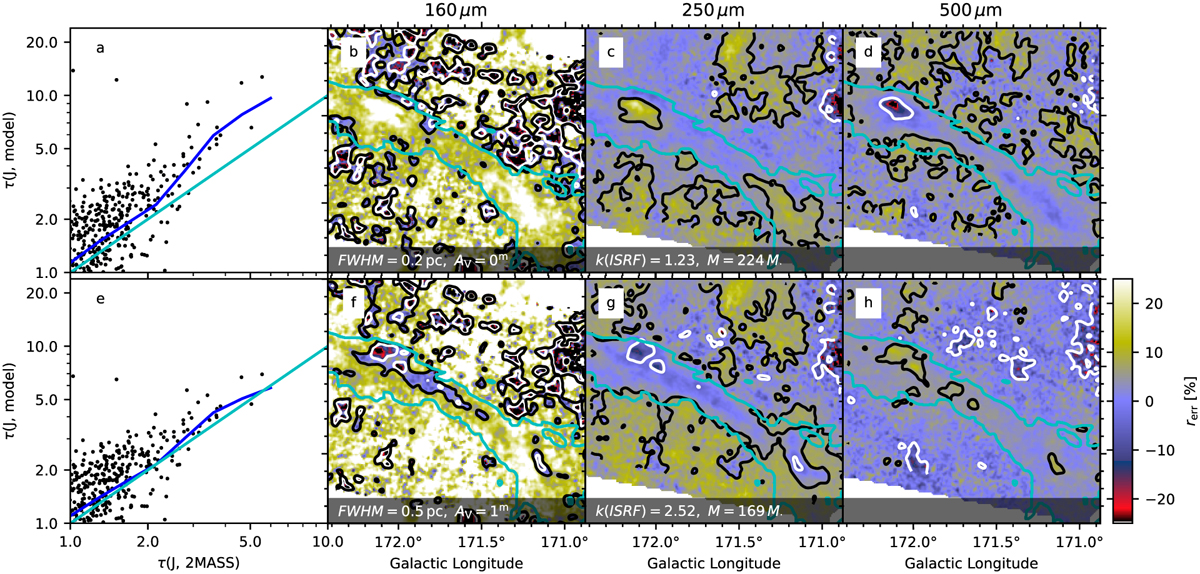
Fits with the modified CMM-3 dust. The upper frames correspond to a FWHM = 0.2 pc and AV = 0mag model and the lower frames to a FWHM = 0.5 pc and AV = 1mag model. The leftmost frames show the model-predicted J-band optical depths against the values measured with 2MASS stars. Dots show the values for individual stars, the solid blue line is a moving average, and the straight cyan line corresponds to the one-to-one relation. The other frames show the 160, 250, and 500 µm fit residuals (rerr), where the −5% and +5% error levels are indicated with white and black contours, respectively. It is noteworthy that in the regions B and C (B212 and B215) the 250 µm and 500 µm residuals have different signs in the two models.
Current usage metrics show cumulative count of Article Views (full-text article views including HTML views, PDF and ePub downloads, according to the available data) and Abstracts Views on Vision4Press platform.
Data correspond to usage on the plateform after 2015. The current usage metrics is available 48-96 hours after online publication and is updated daily on week days.
Initial download of the metrics may take a while.