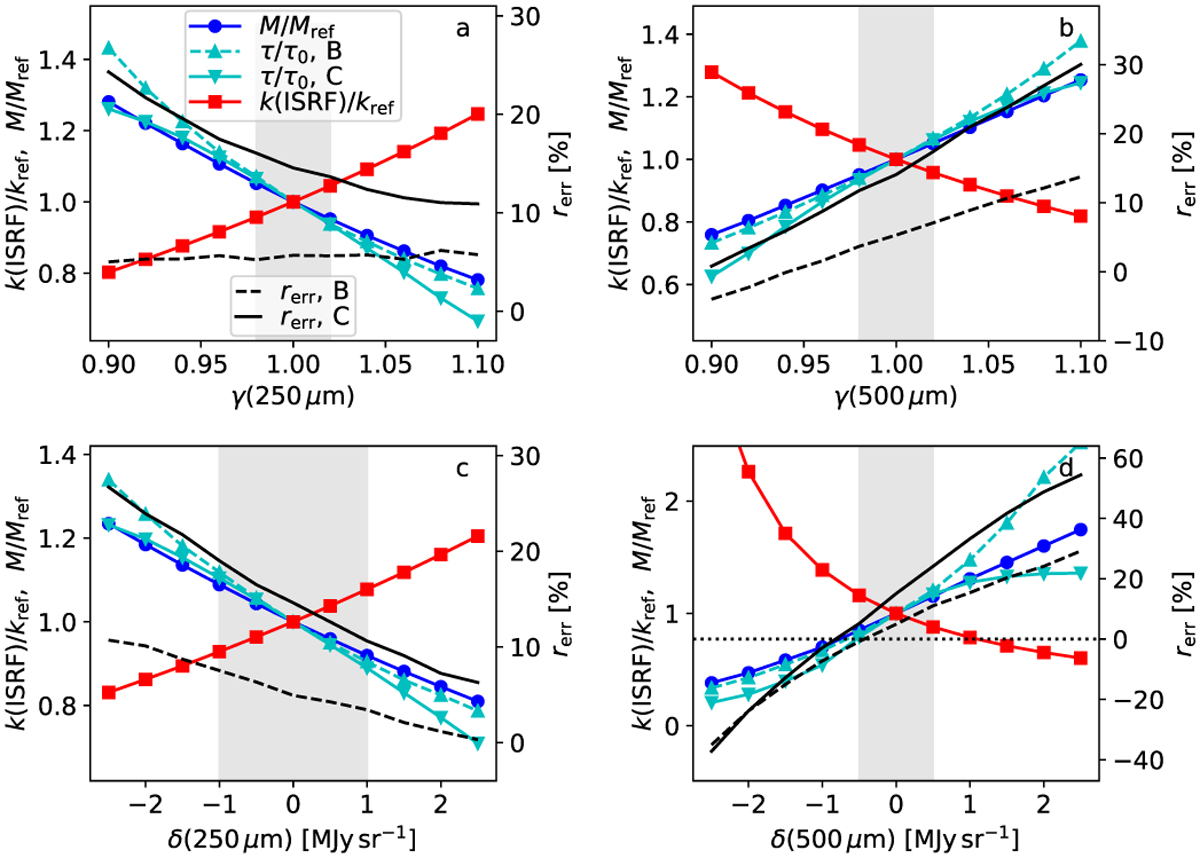
Fig. 18
Download original image
Effects of systematic observational errors. Errors are introduced to the intensity measurements, and the frames show the effects on the filament mass M, radiation field intensity, and optical depths, τ, in sub-regions B and C. The parameters are plotted relative to those estimated with the original observations. Each frame also shows the average 250 µm residuals in the B and C regions (right y axis, dashed and continuous solid lines). The upper frames include multiplicative errors γ in the 250 µm (frame a) or 500 µm (frame b) measurements. The lower frames include additive errors δ in the same bands. The shaded regions indicate probable upper limits limits for the errors in the Taurus observations: 2% for relative calibration and (ad hoc) ±1 MJy sr−1 and ±0.5 MJy sr−1 for the 250 µm and 500 µm zero points, respectively.
Current usage metrics show cumulative count of Article Views (full-text article views including HTML views, PDF and ePub downloads, according to the available data) and Abstracts Views on Vision4Press platform.
Data correspond to usage on the plateform after 2015. The current usage metrics is available 48-96 hours after online publication and is updated daily on week days.
Initial download of the metrics may take a while.