Fig. 16
Download original image
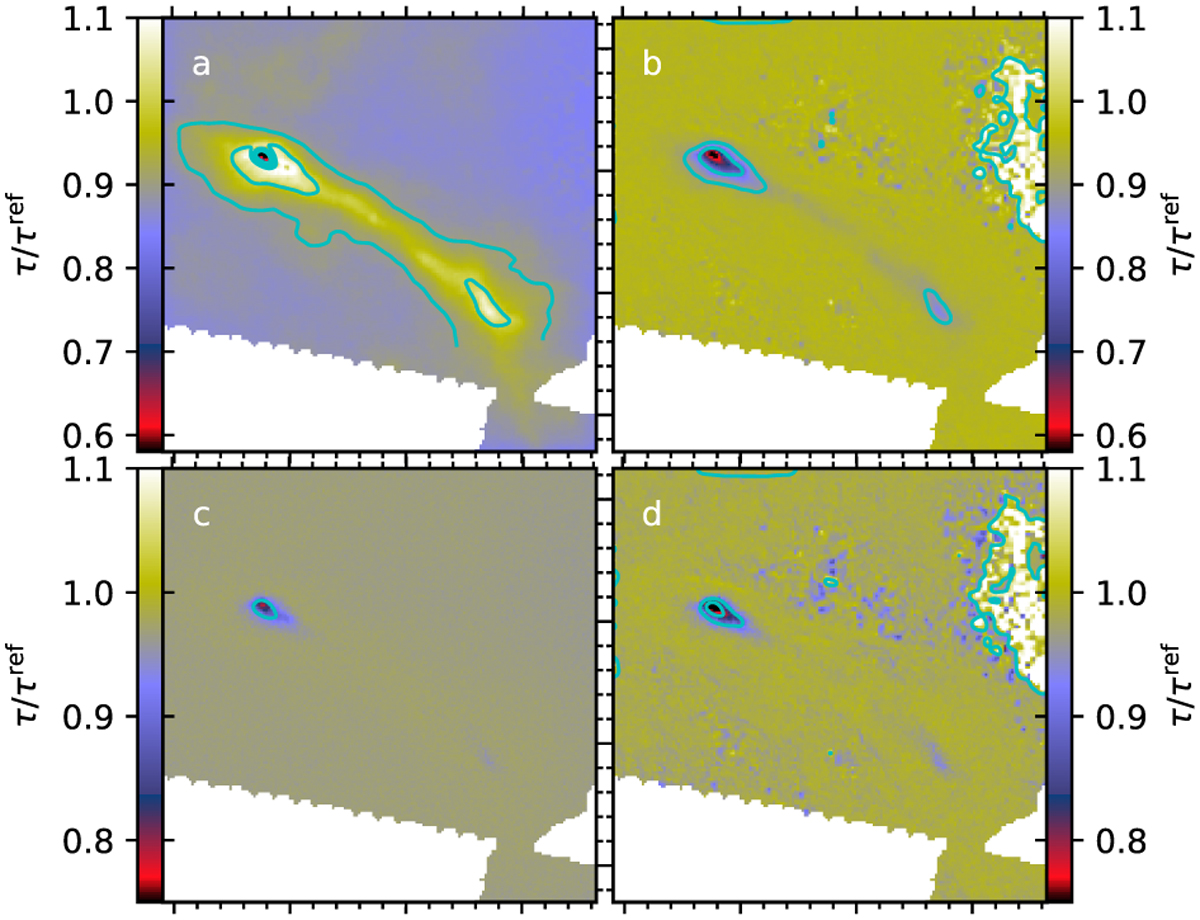
MBB optical depth estimates calculated for synthetic observations from RT models. The uppermost frames show the results of MBB fits with a single temperature component (β = 1.8 in frame a, β = 2.0 in frame b) relative to the actual optical depths in the model. The second row shows the corresponding ratios for MBB fits with Gaussian temperature distributions. The RT models (FWHM = 0.5 pc, AV = 1mag) used either the COM (frames a and c) or the CMM dust (frames b and d). The cyan contours are drawn at the values of 0.8, 0.9, and 1.0.
Current usage metrics show cumulative count of Article Views (full-text article views including HTML views, PDF and ePub downloads, according to the available data) and Abstracts Views on Vision4Press platform.
Data correspond to usage on the plateform after 2015. The current usage metrics is available 48-96 hours after online publication and is updated daily on week days.
Initial download of the metrics may take a while.