Fig. 15
Download original image
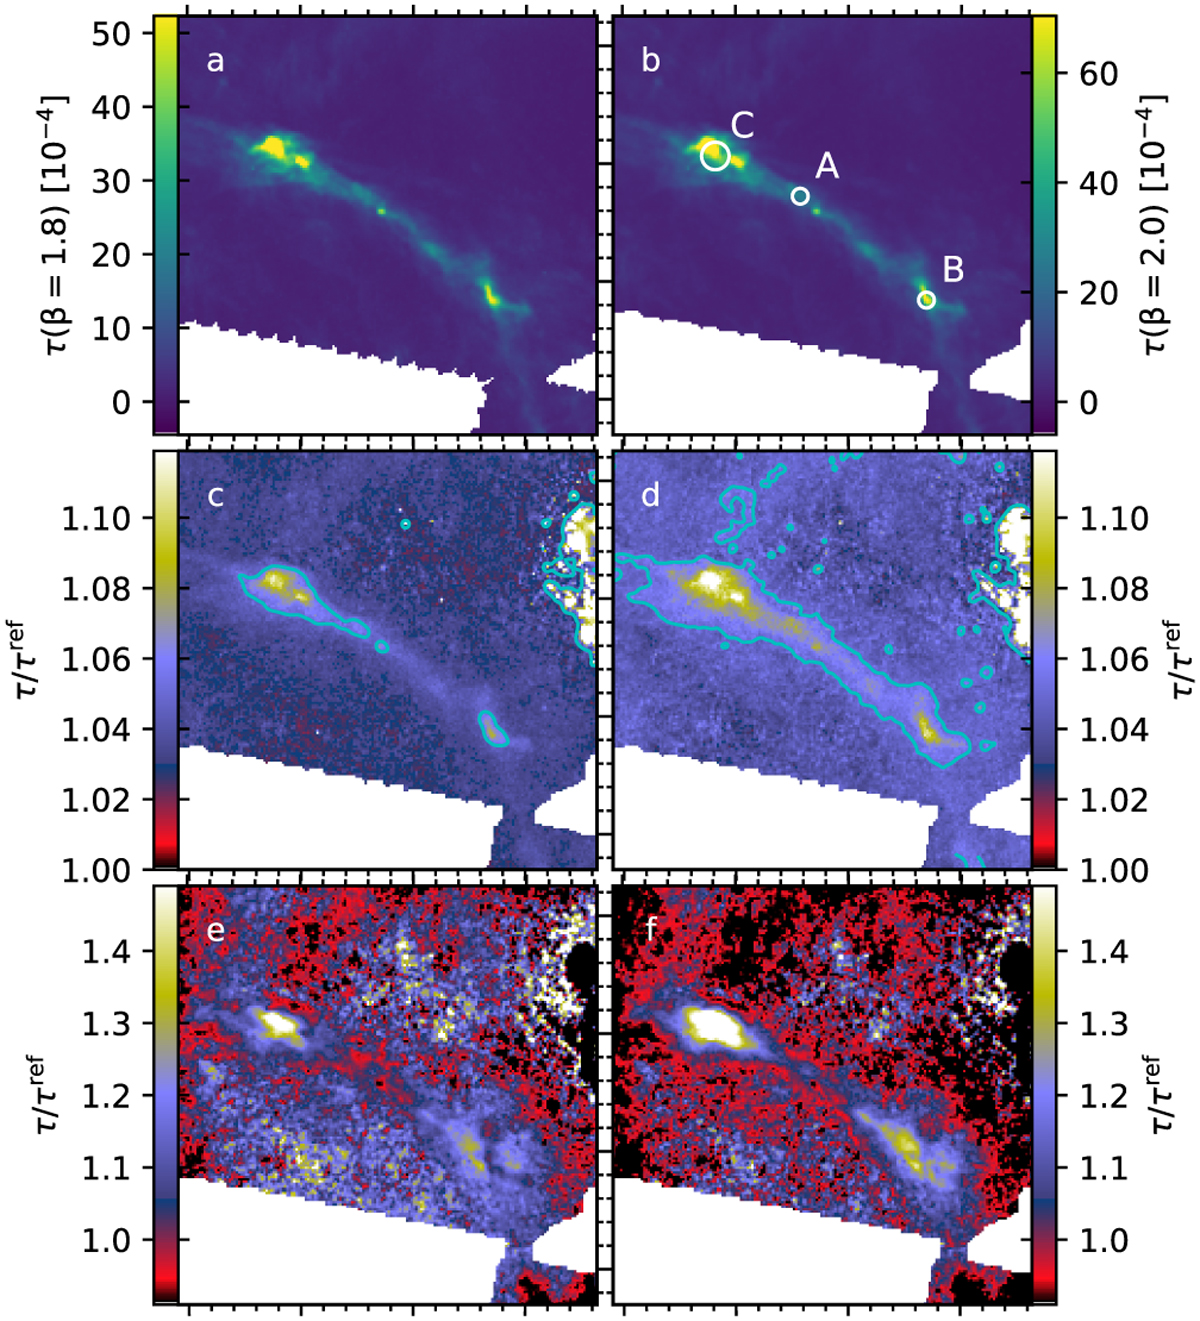
Comparison of 250 µm optical depth estimates from MBB fits and RT models. The upper frames show the results of single-temperature MBB fits with β = 1.8 (frame a) and β = 2.0 (frame b). The second row shows the ratios between the MBB fit with a Gaussian temperature distribution and the corresponding single-temperature fit from the first row, with contours drawn at levels of ±5%. The bottom row shows the τ ratios for two RT models (FWHM = 0.5 pc, AV = 1mag) and the single-temperature MBB fits from above. The dust models are COM in frame e and CMM in frame f.
Current usage metrics show cumulative count of Article Views (full-text article views including HTML views, PDF and ePub downloads, according to the available data) and Abstracts Views on Vision4Press platform.
Data correspond to usage on the plateform after 2015. The current usage metrics is available 48-96 hours after online publication and is updated daily on week days.
Initial download of the metrics may take a while.