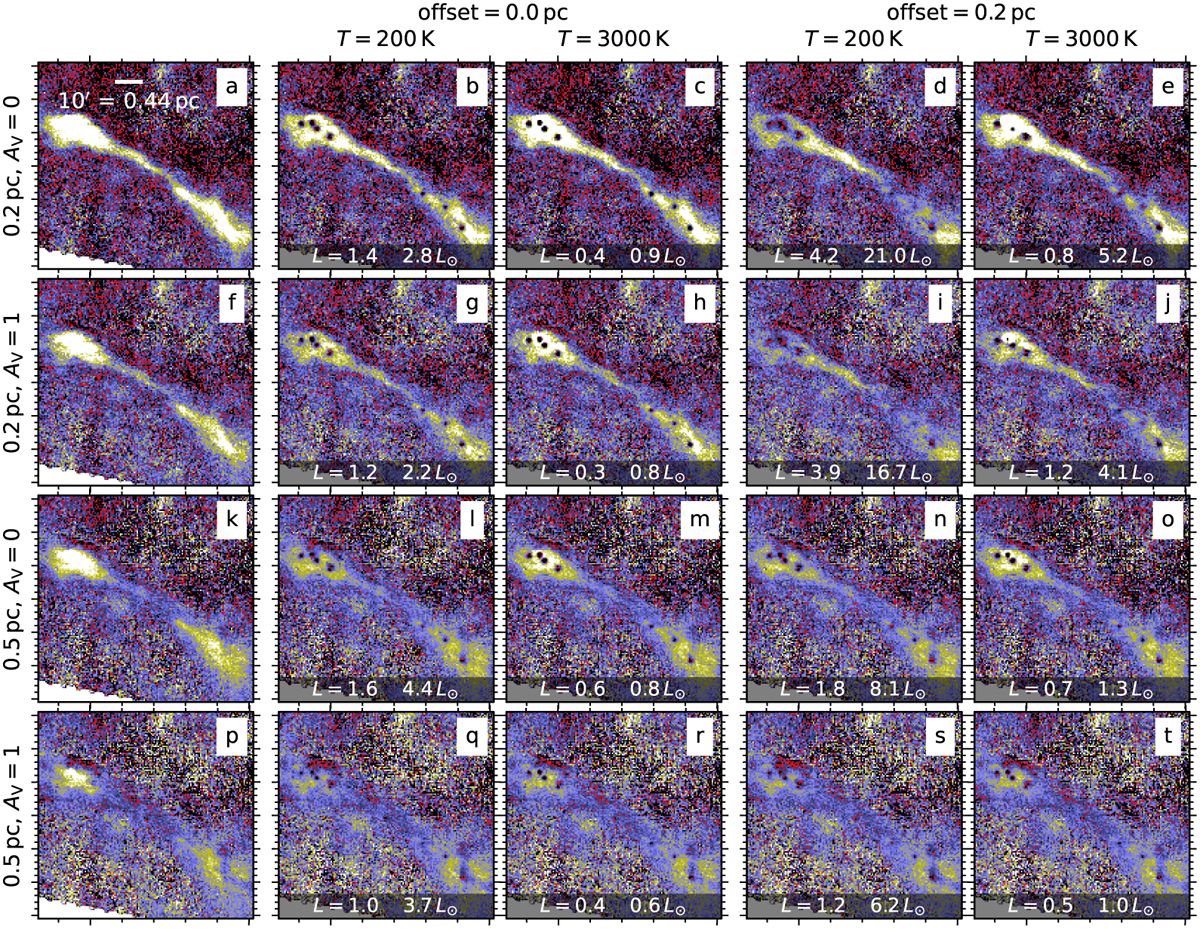
Fig. 12
Download original image
Comparison of 250 µm fit residuals for models with hypothetical embedded sources. Each row corresponds to a combination of FWHM and AV values, as noted on the left side of the frames. Each column of frames corresponds to a different case concerning the point sources: Col. 1 is without sources, Cols. 2–3 with sources embedded at the location of the LOS density maximum, and Cols. 3–4 with sources displaced 0.2 pc along the LOS from to the density maximum. The temperatures of the point sources are given above each column of frames.
Current usage metrics show cumulative count of Article Views (full-text article views including HTML views, PDF and ePub downloads, according to the available data) and Abstracts Views on Vision4Press platform.
Data correspond to usage on the plateform after 2015. The current usage metrics is available 48-96 hours after online publication and is updated daily on week days.
Initial download of the metrics may take a while.