Fig. 10
Download original image
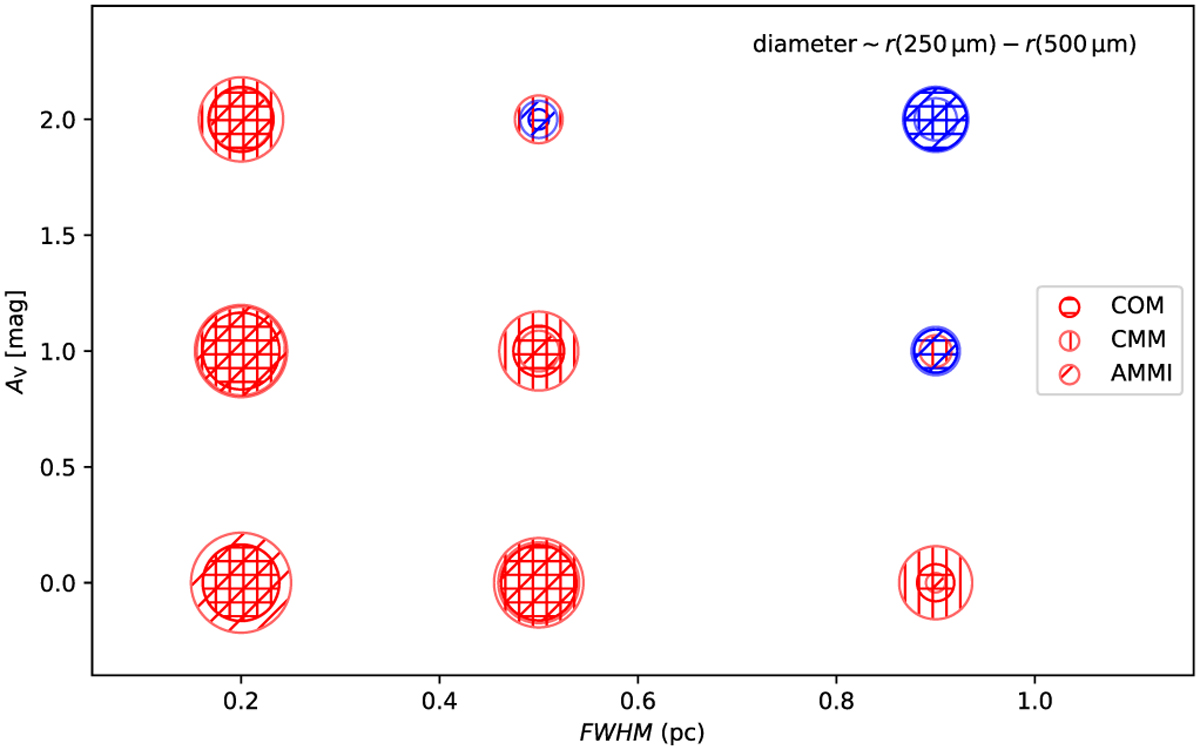
Details are the same as in Fig. 9, but displaying the relative fit residuals (250 µm residual minus 500 µm residual) in region C. Red symbols correspond to cases where the 250 µm emission is underestimated and 500 µm emission is underestimated towards the main core. In the case of the blue symbols the situation is reversed: with larger LOS extent and large external extinction, the models overestimate rather than underestimate the dust temperature in the core.
Current usage metrics show cumulative count of Article Views (full-text article views including HTML views, PDF and ePub downloads, according to the available data) and Abstracts Views on Vision4Press platform.
Data correspond to usage on the plateform after 2015. The current usage metrics is available 48-96 hours after online publication and is updated daily on week days.
Initial download of the metrics may take a while.