Fig. 1
Download original image
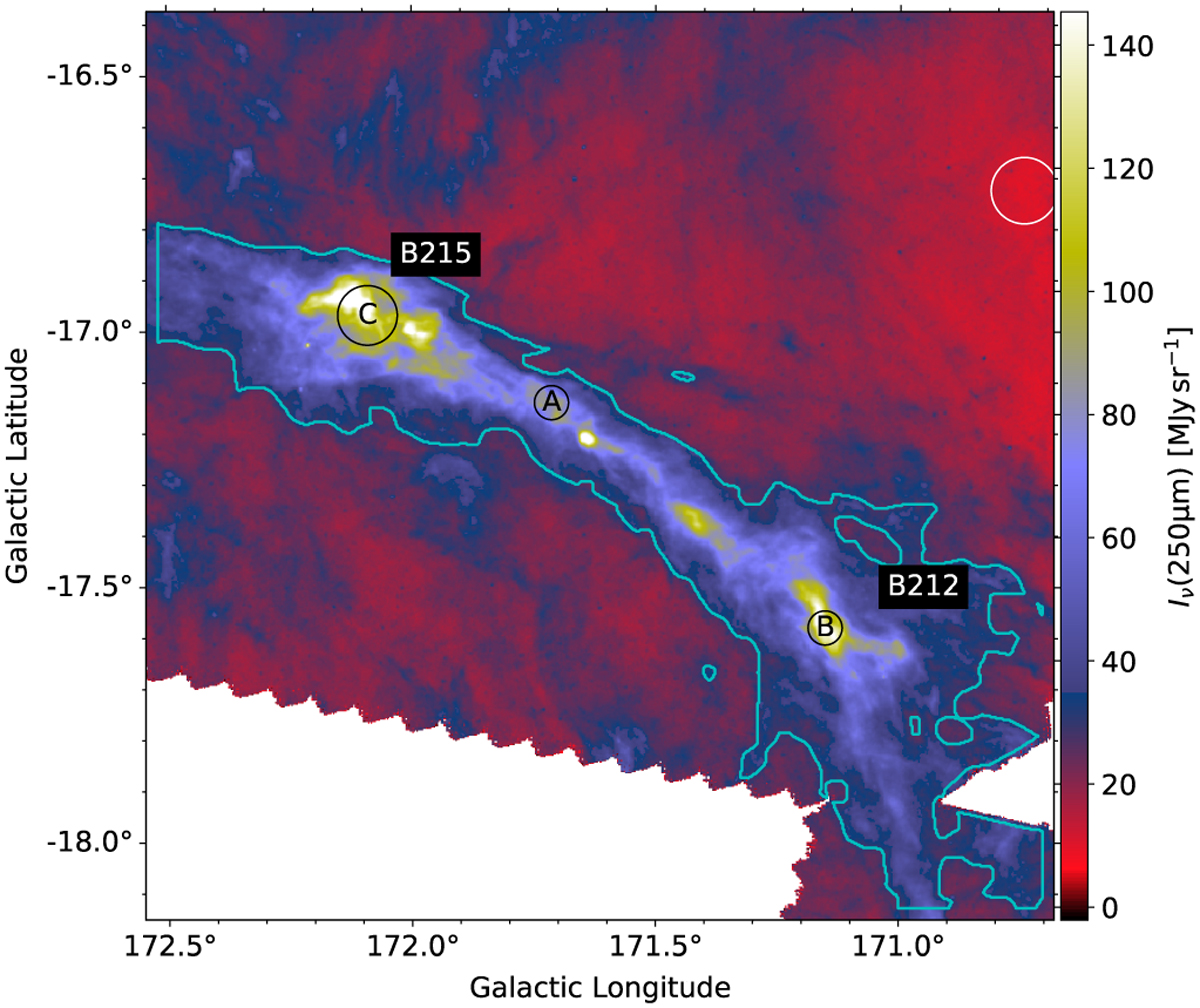
Herschel 250 µm map of the Taurus filament. The model fits are compared mainly to the data inside the cyan contour (“filament region”), which corresponds to 10 MJy sr−1 in the background-subtracted 350 µm map. The circles labelled A-C correspond to selected small regions, in order of increasing column density, that are used in the model comparisons. The white circle shows the area used for background subtraction.
Current usage metrics show cumulative count of Article Views (full-text article views including HTML views, PDF and ePub downloads, according to the available data) and Abstracts Views on Vision4Press platform.
Data correspond to usage on the plateform after 2015. The current usage metrics is available 48-96 hours after online publication and is updated daily on week days.
Initial download of the metrics may take a while.