Fig. 3
Download original image
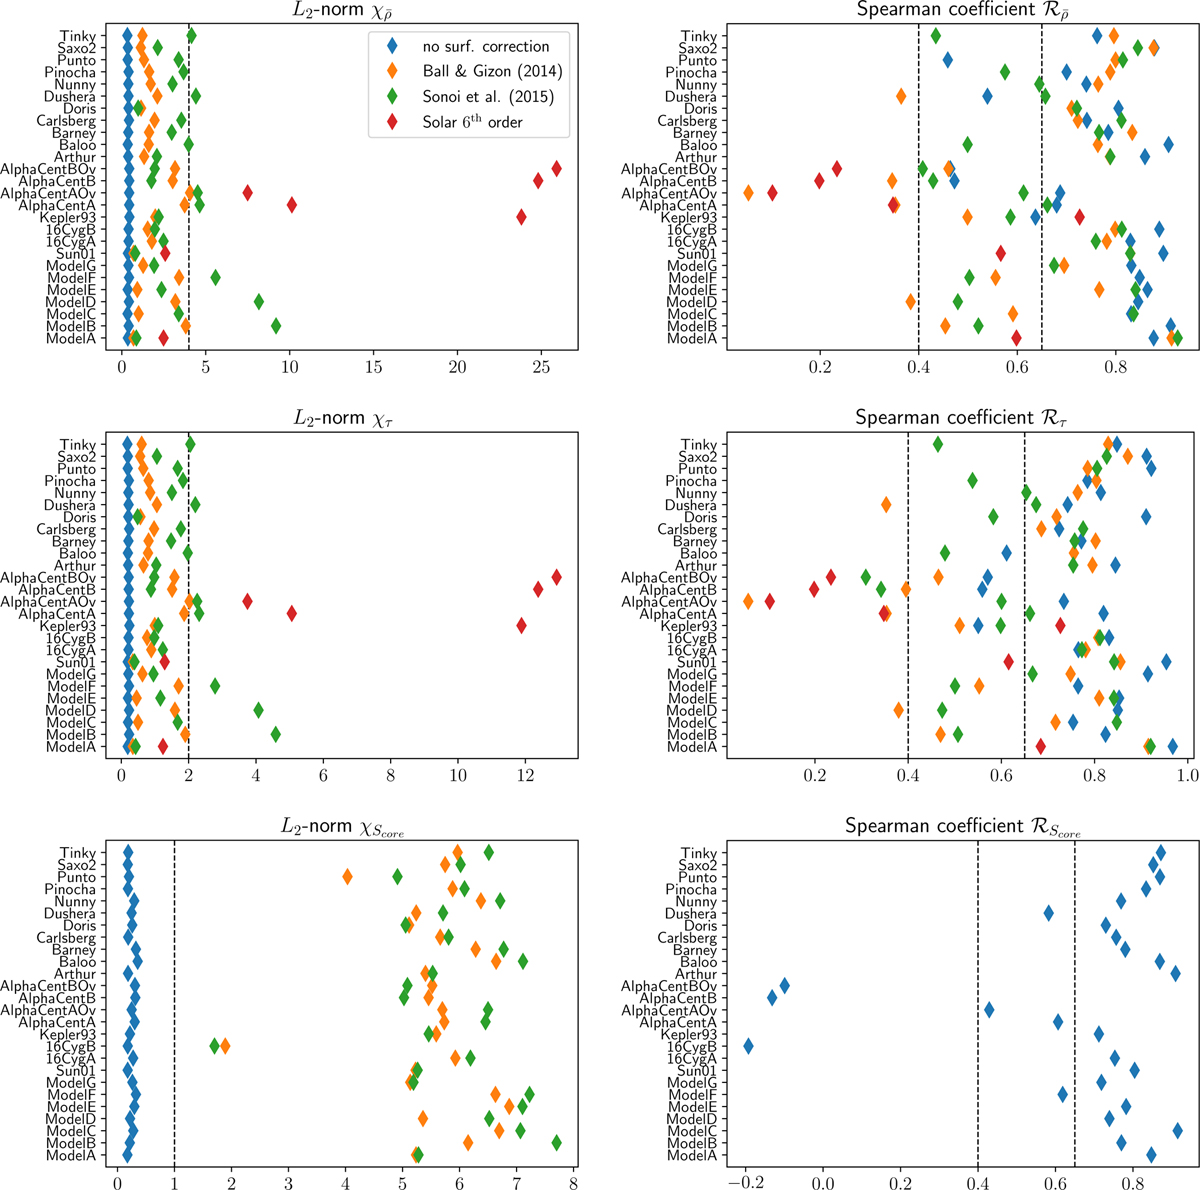
Quality assessment results of the inversion carried out on our testing set by considering different surface effect prescriptions. Left column: quality of the fit of the target function by the averaging kernel quantified by χt. Right column: spearman coefficient ℛt of the lag plot. Top line: results of the mean density inversions. Middle line: results of the acoustic radius inversions. Bottom line: results of the central entropy inversions. The vertical dashed black lines delimit the different regimes of the selection flags.
Current usage metrics show cumulative count of Article Views (full-text article views including HTML views, PDF and ePub downloads, according to the available data) and Abstracts Views on Vision4Press platform.
Data correspond to usage on the plateform after 2015. The current usage metrics is available 48-96 hours after online publication and is updated daily on week days.
Initial download of the metrics may take a while.