Fig. 2
Download original image
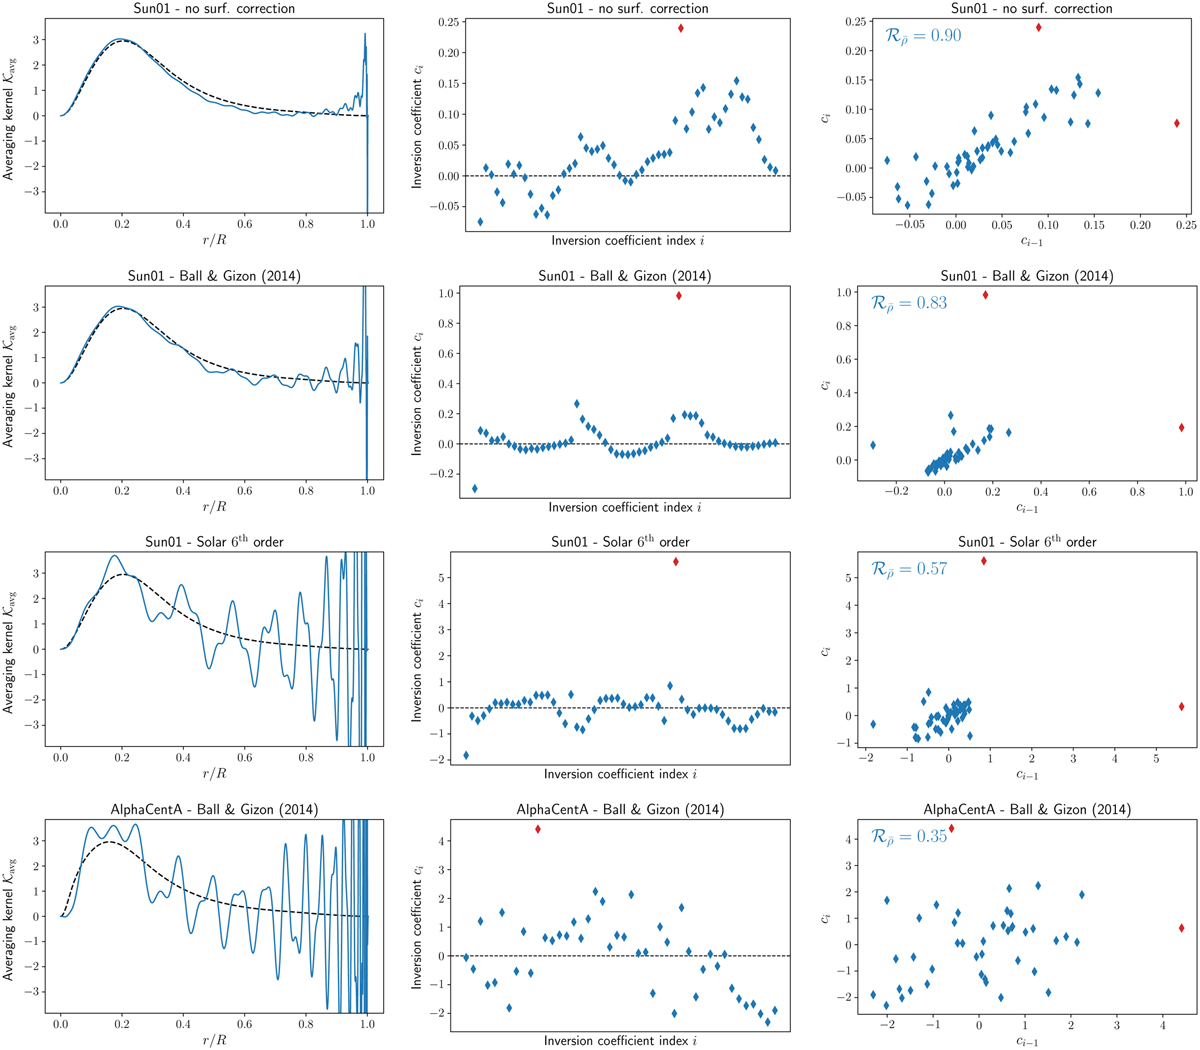
Diagnostic plots of the solar model and of the α Cen A model. From top to bottom: diagnostic plots of the solar model by neglecting the surface effects, using the Ball & Gizon (2014) surface effect prescription, and using a sixth-order polynomial for the surface effects; and diagnostic plots of α Cen A using the Ball & Gizon (2014) prescription. Left column: fit of the target function by the averaging kernel. Central column: inversion coefficients. Right column: lag plot of the inversion coefficients. The points in red are the values that were excluded.
Current usage metrics show cumulative count of Article Views (full-text article views including HTML views, PDF and ePub downloads, according to the available data) and Abstracts Views on Vision4Press platform.
Data correspond to usage on the plateform after 2015. The current usage metrics is available 48-96 hours after online publication and is updated daily on week days.
Initial download of the metrics may take a while.