Fig. 9.
Download original image
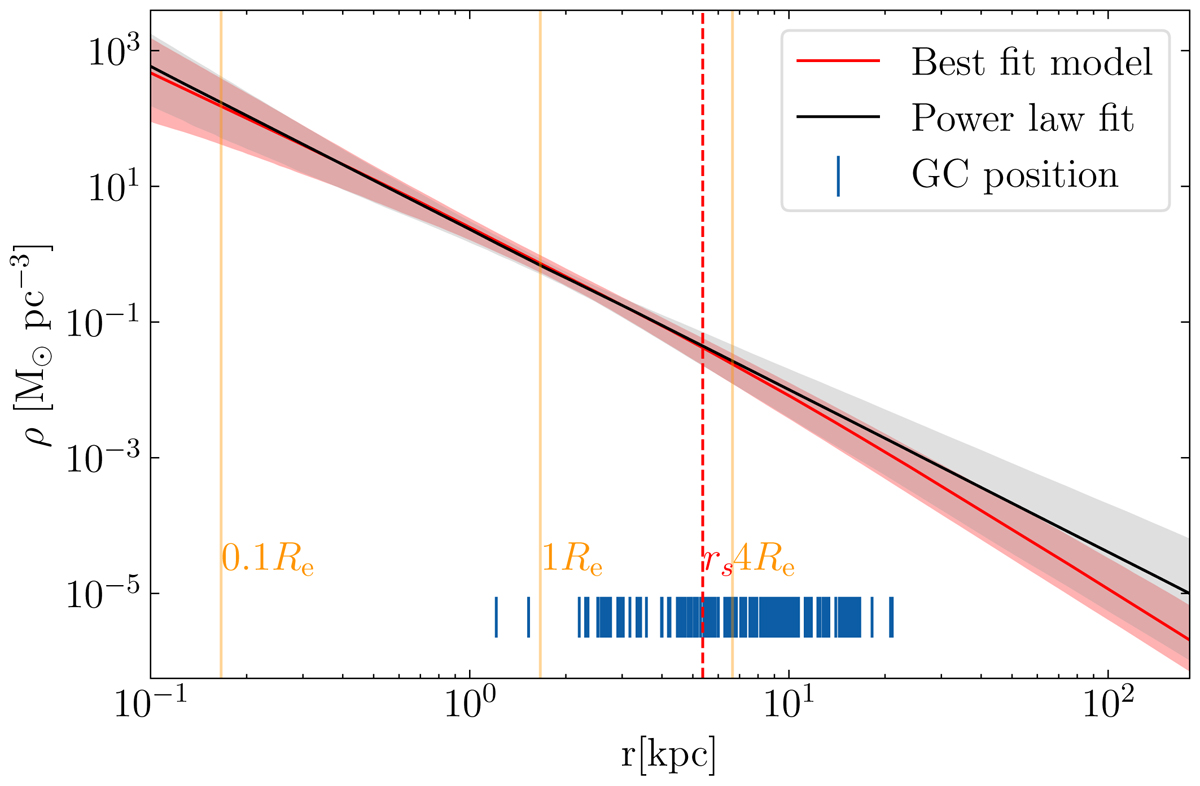
Total mass density of NGC 3115 from the fiducial model. The red solid line with the associated shaded region shows the median, and the 16th and 84th percentiles of the total mass density profile. The red dashed line shows the median scale radius of the total mass density profile. The black solid line and grey shaded regions show the resulting single power-law fit in the region 0.1 < r/Re < 4 and the 1σ uncertainties, as explained in Sect. 5.4. The orange vertical lines show the stellar effective radius and the blue lines indicate the positions of the tracers for reference.
Current usage metrics show cumulative count of Article Views (full-text article views including HTML views, PDF and ePub downloads, according to the available data) and Abstracts Views on Vision4Press platform.
Data correspond to usage on the plateform after 2015. The current usage metrics is available 48-96 hours after online publication and is updated daily on week days.
Initial download of the metrics may take a while.