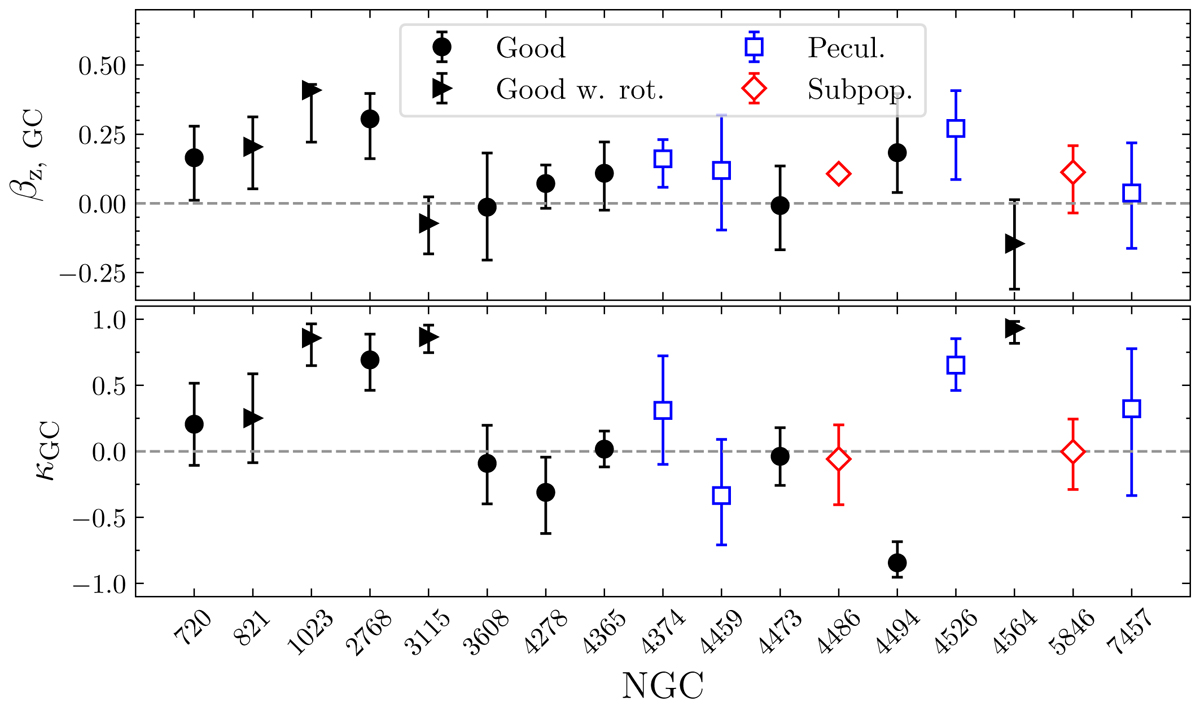
Fig. 8.
Download original image
Best-fit velocity anisotropy and rotation from model C. The symbols match those in Fig. 6; the black points are the galaxies with robust measurements and the open symbols those without. The top panel shows the velocity anisotropy for each galaxy and the bottom panel shows the rotation parameter κ. The error bars highlight the 16th and 84th percentile uncertainty on the measurement. The dashed grey line shows the isotropic βz = 0 and non-rotating κ = 0 values for reference.
Current usage metrics show cumulative count of Article Views (full-text article views including HTML views, PDF and ePub downloads, according to the available data) and Abstracts Views on Vision4Press platform.
Data correspond to usage on the plateform after 2015. The current usage metrics is available 48-96 hours after online publication and is updated daily on week days.
Initial download of the metrics may take a while.