Fig. 7.
Download original image
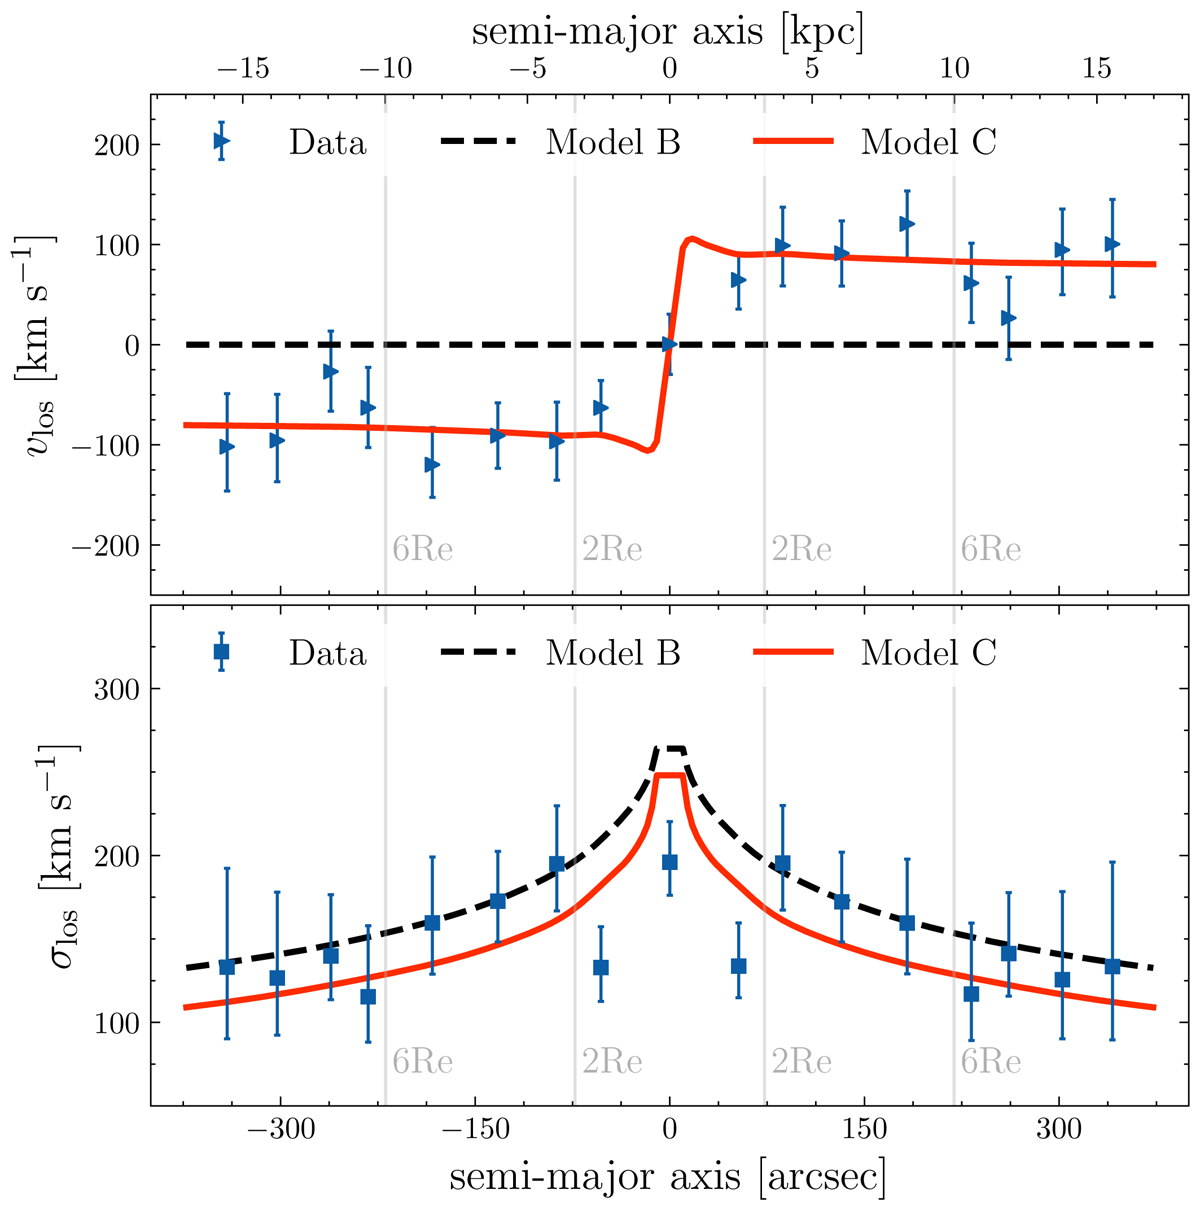
Comparison between the best-fit results from models B and C and the data for NGC 3115 along the semi-major axis of the galaxy. The top panel shows the mean velocity and the bottom the velocity dispersion. The blue triangles and squares show the mean velocity and velocity dispersion of the GCs, respectively. The black dashed line shows the velocity dispersion computed with the best-fit parameters of model B. The solid red line shows the same for model C. The vertical grey lines show multiples of the stellar effective radius for comparison.
Current usage metrics show cumulative count of Article Views (full-text article views including HTML views, PDF and ePub downloads, according to the available data) and Abstracts Views on Vision4Press platform.
Data correspond to usage on the plateform after 2015. The current usage metrics is available 48-96 hours after online publication and is updated daily on week days.
Initial download of the metrics may take a while.