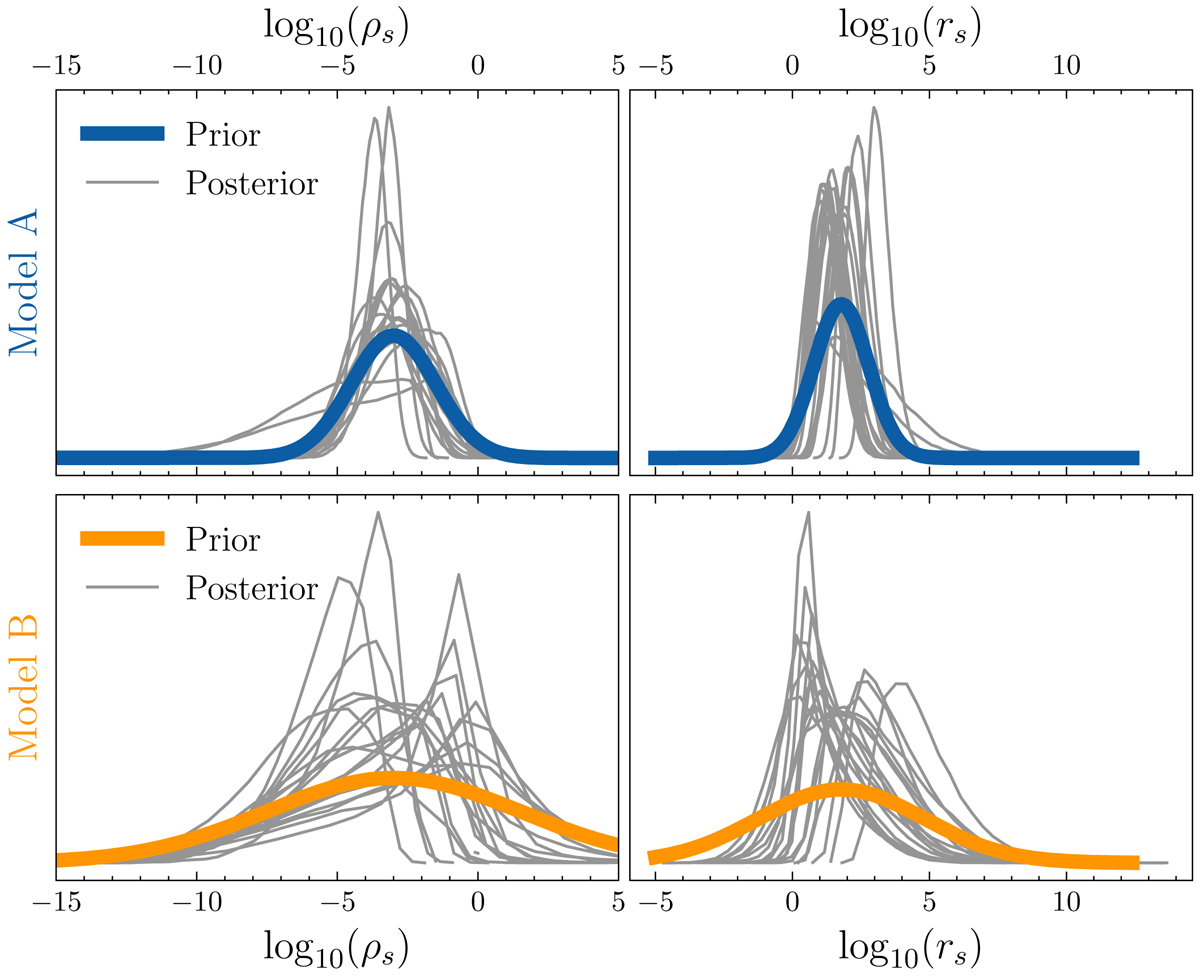
Fig. 5.
Download original image
Comparison between informative priors for log10ρs and log10rs as coloured lines for model A and model B and the posteriors for each of the 21 modelled galaxies as grey lines. In fiducial model B the widths of the posteriors are narrower than those of the priors, which indicates that the data is driving the posterior, not the prior.
Current usage metrics show cumulative count of Article Views (full-text article views including HTML views, PDF and ePub downloads, according to the available data) and Abstracts Views on Vision4Press platform.
Data correspond to usage on the plateform after 2015. The current usage metrics is available 48-96 hours after online publication and is updated daily on week days.
Initial download of the metrics may take a while.