Fig. 2.
Download original image
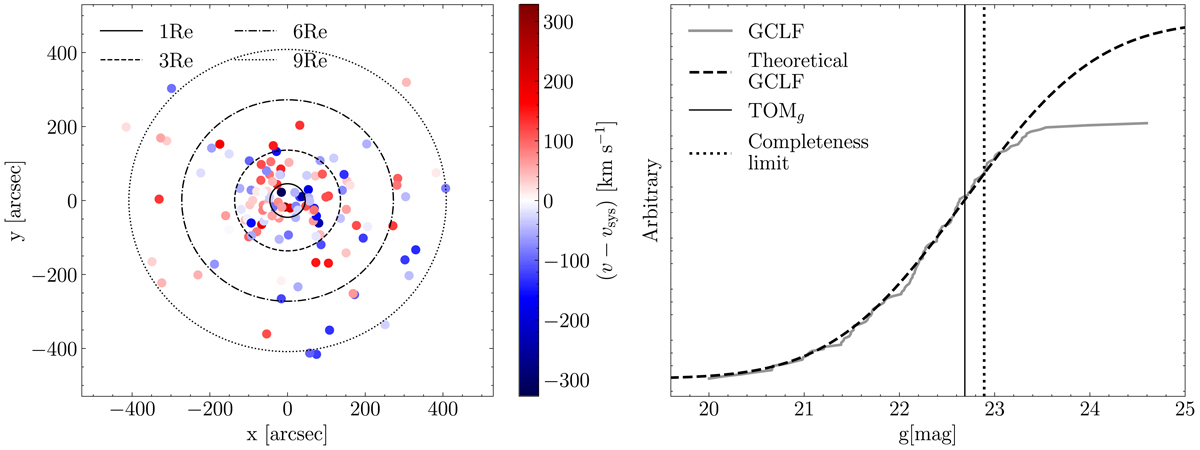
Example of spatial and magnitude distribution of the kinematic tracers. Both were used to determine an observationally unbiased sample of GCs to construct the tracer density profile for each galaxy. The left panel shows the spatial distribution of the GCs in NGC 3377 centred at the coordinates of the host galaxy and aligned with the photometric position angle. The GCs are colour-coded by their velocity corrected for the systemic velocity of the galaxy. The kinematic tracers extend beyond 9 Re. The solid grey line in the right panel shows the GCLF of NGC 3377. The dashed black curve shows the arbitrarily scaled theoretical GCLF; the turn-over magnitude is indicated with a vertical solid black line. The vertical dotted line shows the magnitude completeness of the sample, determined as described in the text.
Current usage metrics show cumulative count of Article Views (full-text article views including HTML views, PDF and ePub downloads, according to the available data) and Abstracts Views on Vision4Press platform.
Data correspond to usage on the plateform after 2015. The current usage metrics is available 48-96 hours after online publication and is updated daily on week days.
Initial download of the metrics may take a while.