Fig. 13.
Download original image
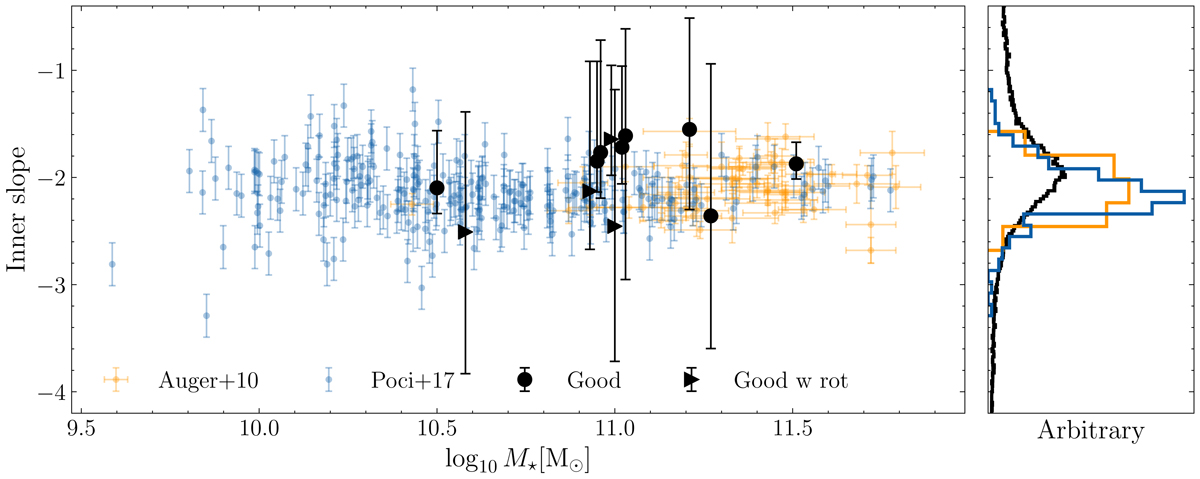
Relation between stellar mass and inner slope (left panel) and distribution of the slopes as determined by this work and literature samples (right panel). The measurements from this work show the intrinsic inner slope α from Eq. (6), those from the literature show the single power-law slope γtot. The black-filled circles and triangles show the galaxies with robust measurements representing the inner mass slope α as measured in this study from the GC kinematics, extending out to ∼8 Re. The symbols are the same as in Fig. 6. Large literature samples focused on the single power-law slope only. They are shown as blue and orange points from Poci et al. (2017) and Auger et al. (2010), respectively. The gravitational lensing from the former study constrained the slope within 0.5 Re, and the latter used stellar kinematics within ∼0.9 Re. The arbitrary scaled distribution of the measurements in the right panel shows the distribution of the slopes with colours corresponding to those in the left panel.
Current usage metrics show cumulative count of Article Views (full-text article views including HTML views, PDF and ePub downloads, according to the available data) and Abstracts Views on Vision4Press platform.
Data correspond to usage on the plateform after 2015. The current usage metrics is available 48-96 hours after online publication and is updated daily on week days.
Initial download of the metrics may take a while.