Fig. 12.
Download original image
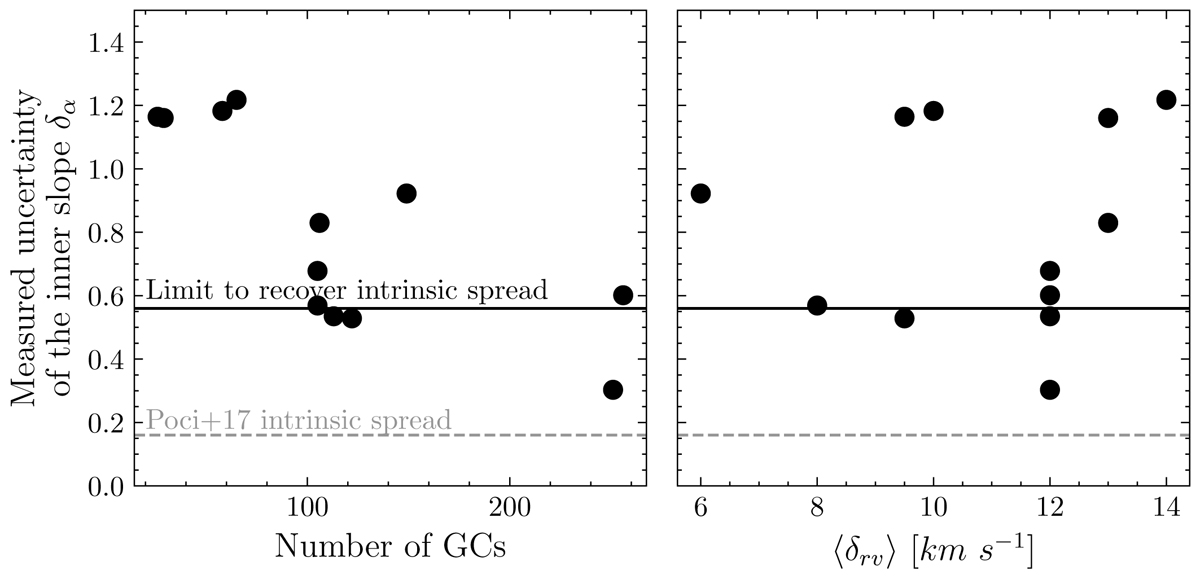
Correlation between the measurement uncertainty of the inner slope (from model B) with the number of GCs per galaxy (left panel) and the median error of the RV (right panel). The grey dashed line indicates the intrinsic scatter of the inner slope of 0.16, as determined by P17 and Auger et al. (2010). In order to constrain the intrinsic slope to the same level, the black solid line indicates the maximum measurement uncertainty needed when using ∼10 galaxies.
Current usage metrics show cumulative count of Article Views (full-text article views including HTML views, PDF and ePub downloads, according to the available data) and Abstracts Views on Vision4Press platform.
Data correspond to usage on the plateform after 2015. The current usage metrics is available 48-96 hours after online publication and is updated daily on week days.
Initial download of the metrics may take a while.