Fig. 11.
Download original image
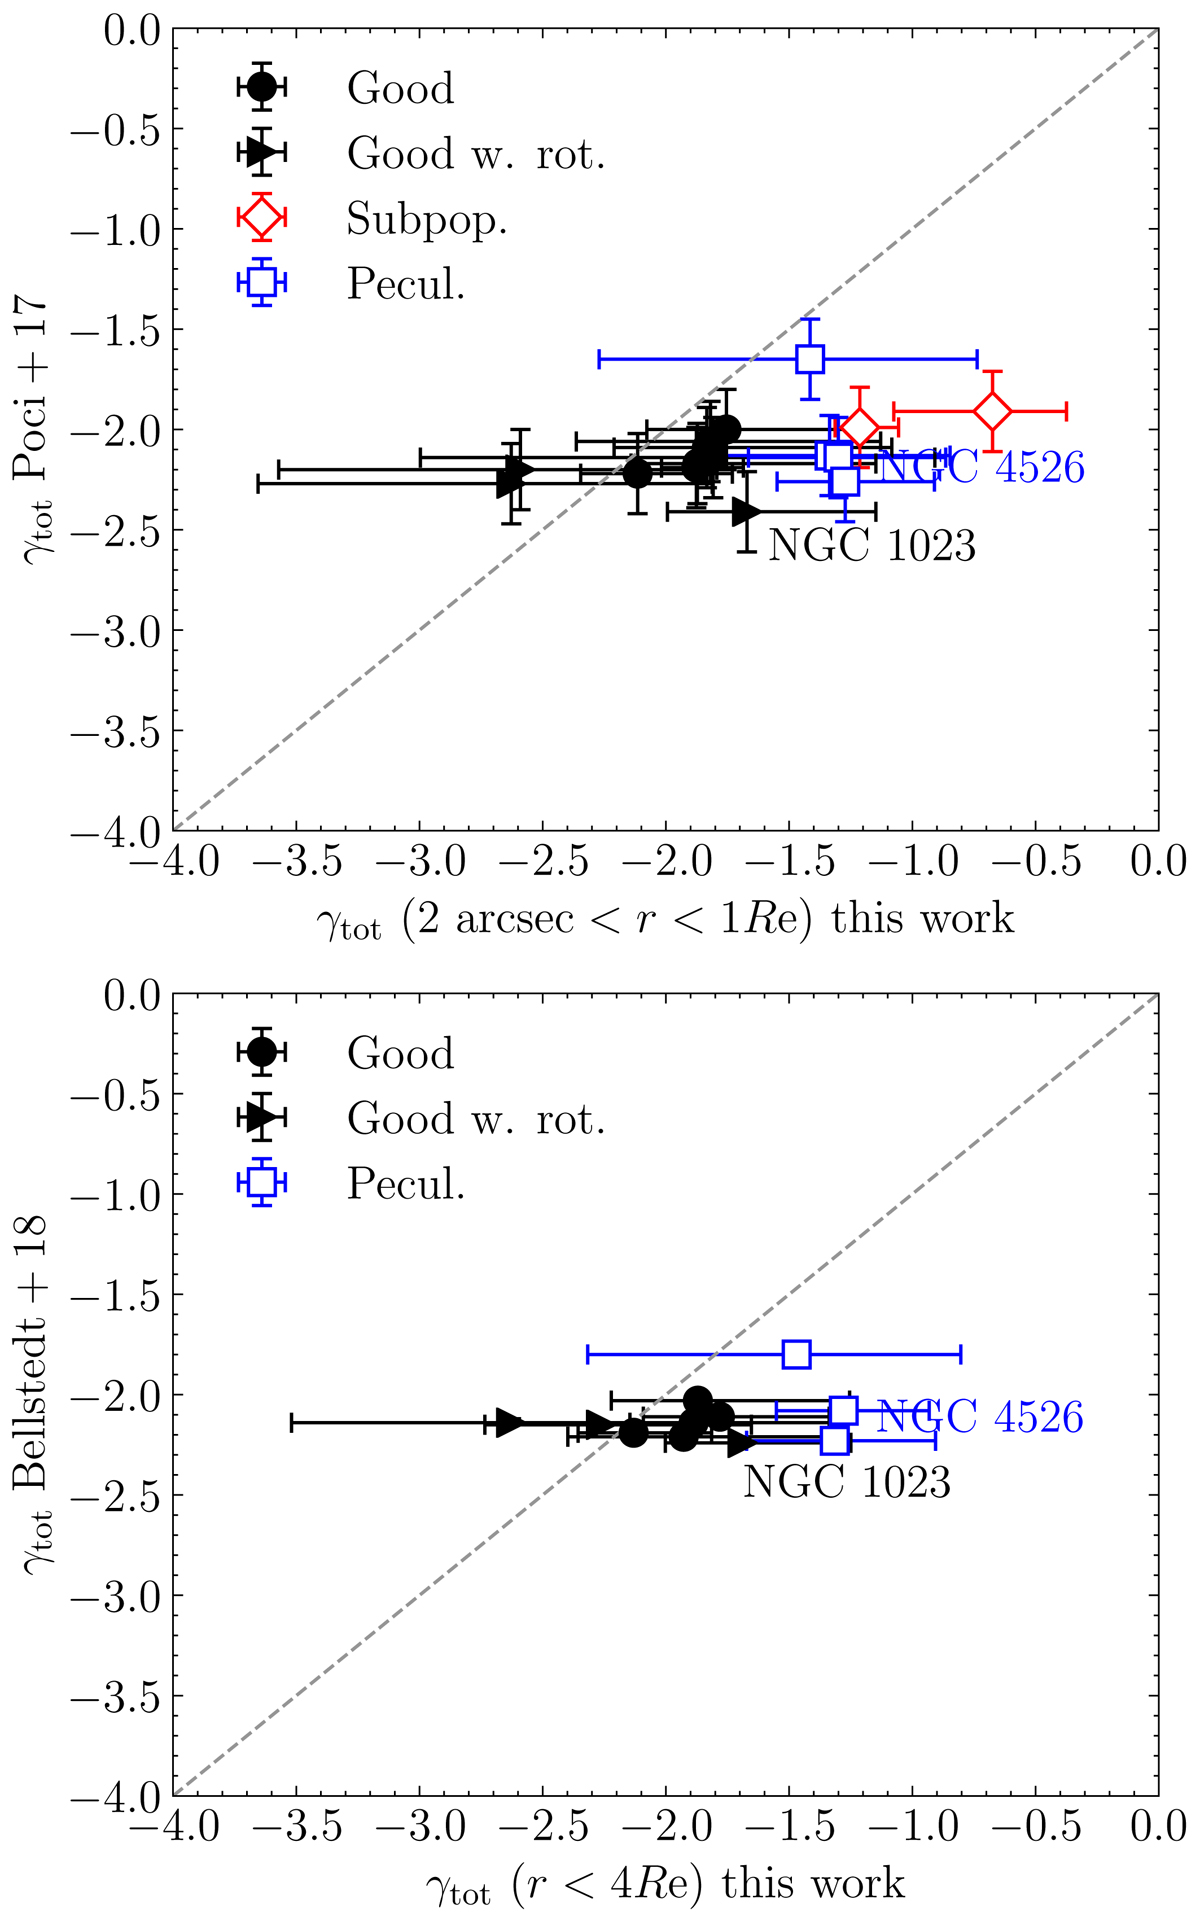
Comparison of the logarithmic slope of the total mass density slope presented in this work on the x-axis and the literature study on the y-axis. The top panel shows the comparison with P17 (model 1) and bottom B18 (model I); the dashed grey line is a 1-to-1 line. The colours and symbols match those in Fig. 6; the solid symbols show robust measurements and the open symbols galaxies excluded from the final analysis. The error bars correspond to the 16th and 84th percentiles, as in Table 6. In both analyses JAM with integrated stellar kinematics was used; this work uses GC kinematics, while the literature studies used stellar kinematics. Within the uncertainties, the measurements of the robust sample agree with the literature values.
Current usage metrics show cumulative count of Article Views (full-text article views including HTML views, PDF and ePub downloads, according to the available data) and Abstracts Views on Vision4Press platform.
Data correspond to usage on the plateform after 2015. The current usage metrics is available 48-96 hours after online publication and is updated daily on week days.
Initial download of the metrics may take a while.