Fig. 10.
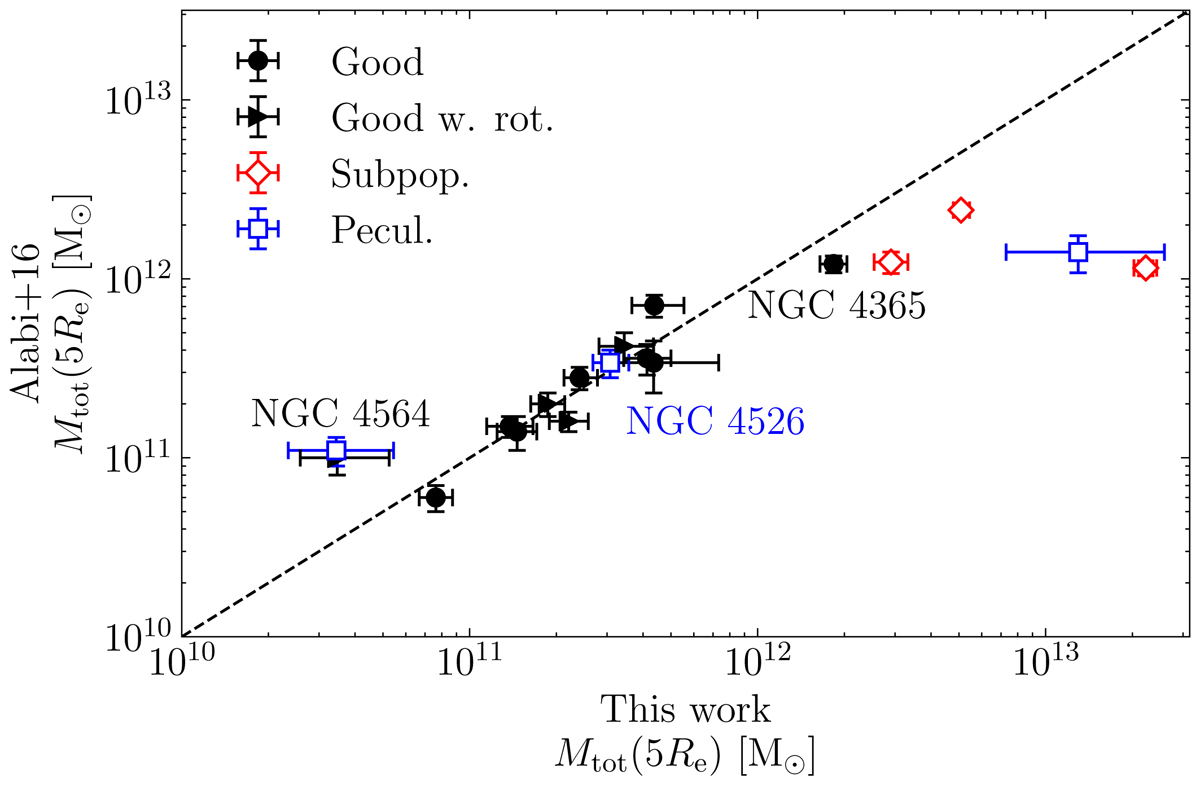
Download original image
Comparison between the enclosed mass within 5 Re measured using GC kinematics presented in this work and in A16. The measurements on the x-axis were obtained with axisymmetric Jeans models assuming a total mass density profile described by Eq. (6) and on the y-axis the literature study used spherical TME with power-law total mass density distribution. The colours and shapes of the points correspond to those used in other figures. The dashed line is a 1–1 line for comparison and not a fit to the data. We find consistent enclosed mass for galaxies with robust measurements, with the exception of NGC 4564 and NGC 4365, highlighted in the figure, which show more than 1σ lower and higher values, respectively.
Current usage metrics show cumulative count of Article Views (full-text article views including HTML views, PDF and ePub downloads, according to the available data) and Abstracts Views on Vision4Press platform.
Data correspond to usage on the plateform after 2015. The current usage metrics is available 48-96 hours after online publication and is updated daily on week days.
Initial download of the metrics may take a while.