Fig. 9.
Download original image
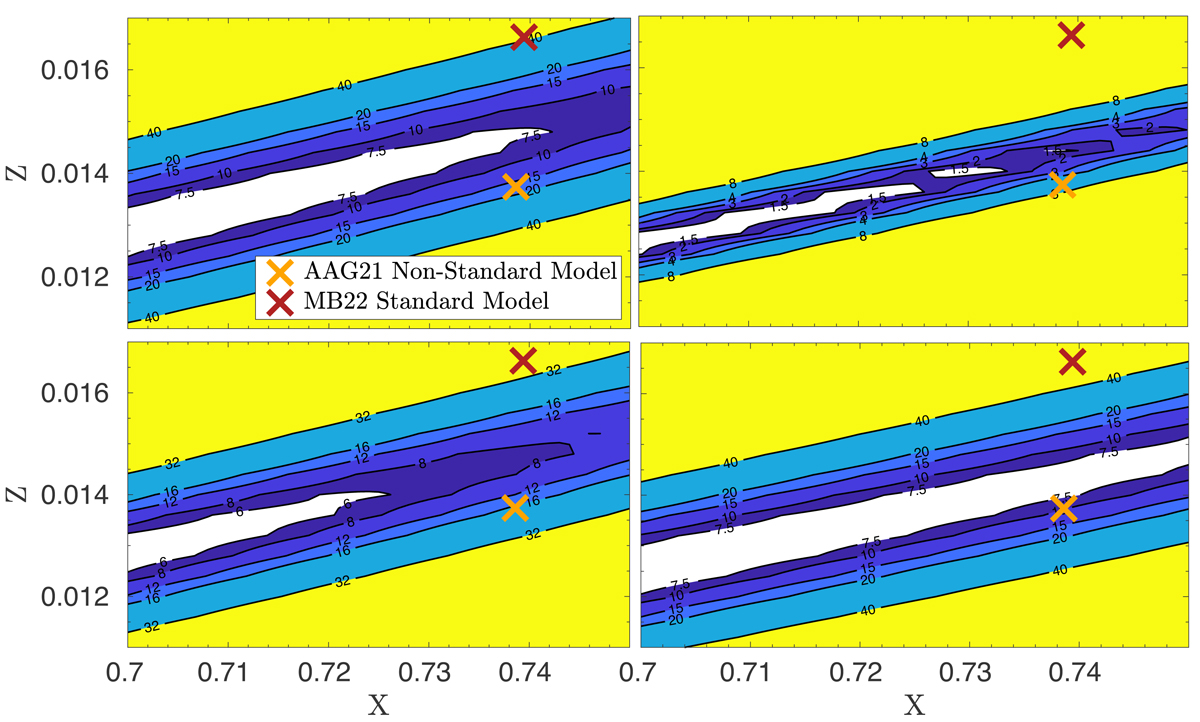
Resulting χ2 map of the X and Z scan for the solar data fitting of Γ1 between 0.72 R⊙ and 0.91 R⊙. The orange crosses indicate the positions of the AAG21 model including rotation and magnetic fields, and the red crosses indicate the MB22 standard solar model (MB22-Phot in Table 2). Values are from their paper. The upper panels used the A2 model, and the lower panels used the M1 model. The left panels used MB22 individual elements, and the right panels used AAG21 individual elements.
Current usage metrics show cumulative count of Article Views (full-text article views including HTML views, PDF and ePub downloads, according to the available data) and Abstracts Views on Vision4Press platform.
Data correspond to usage on the plateform after 2015. The current usage metrics is available 48-96 hours after online publication and is updated daily on week days.
Initial download of the metrics may take a while.