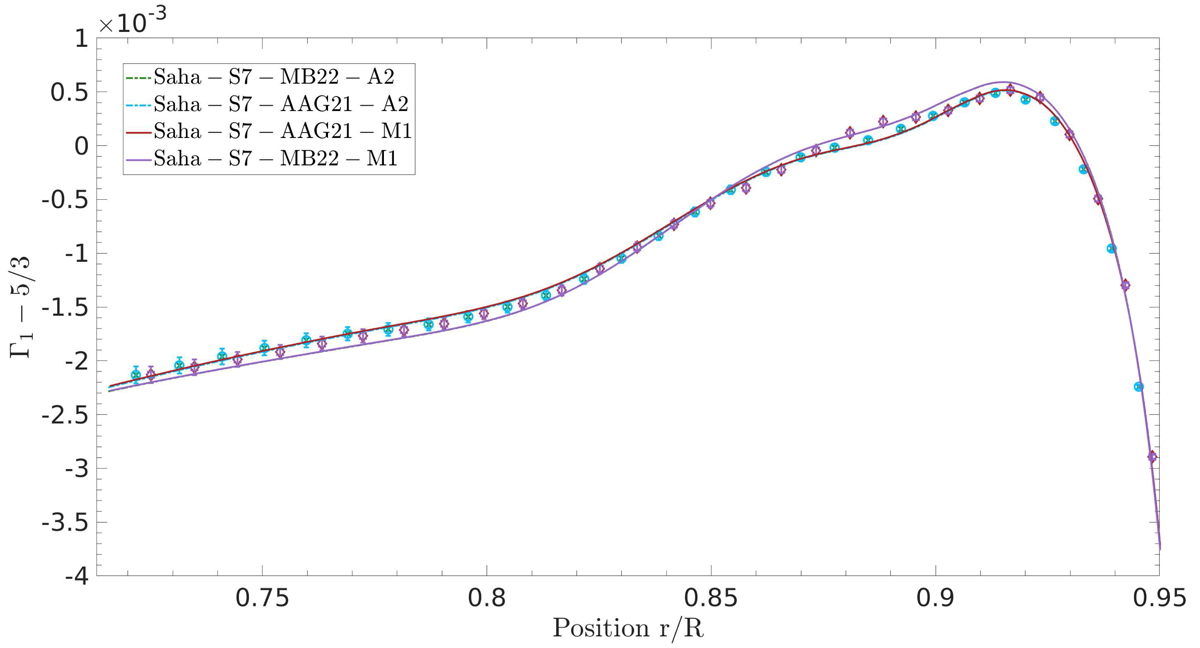
Fig. 8.
Download original image
Inversions of the Γ1 profile as a function of normalised radius determined from solar data assuming SAHA-S v7 as the EOS and changing the ratios of individual elements in the table (from MB22 to AAG21). Two reference models were used in the procedure: models M1 and A2. The results of the reconstructions are plotted in various colours. The red curve overplots the light blue one, and the purple curve overplots the green one. Each symbol depicts the Γ1 inversion results for the associated model (M1 or A2).
Current usage metrics show cumulative count of Article Views (full-text article views including HTML views, PDF and ePub downloads, according to the available data) and Abstracts Views on Vision4Press platform.
Data correspond to usage on the plateform after 2015. The current usage metrics is available 48-96 hours after online publication and is updated daily on week days.
Initial download of the metrics may take a while.