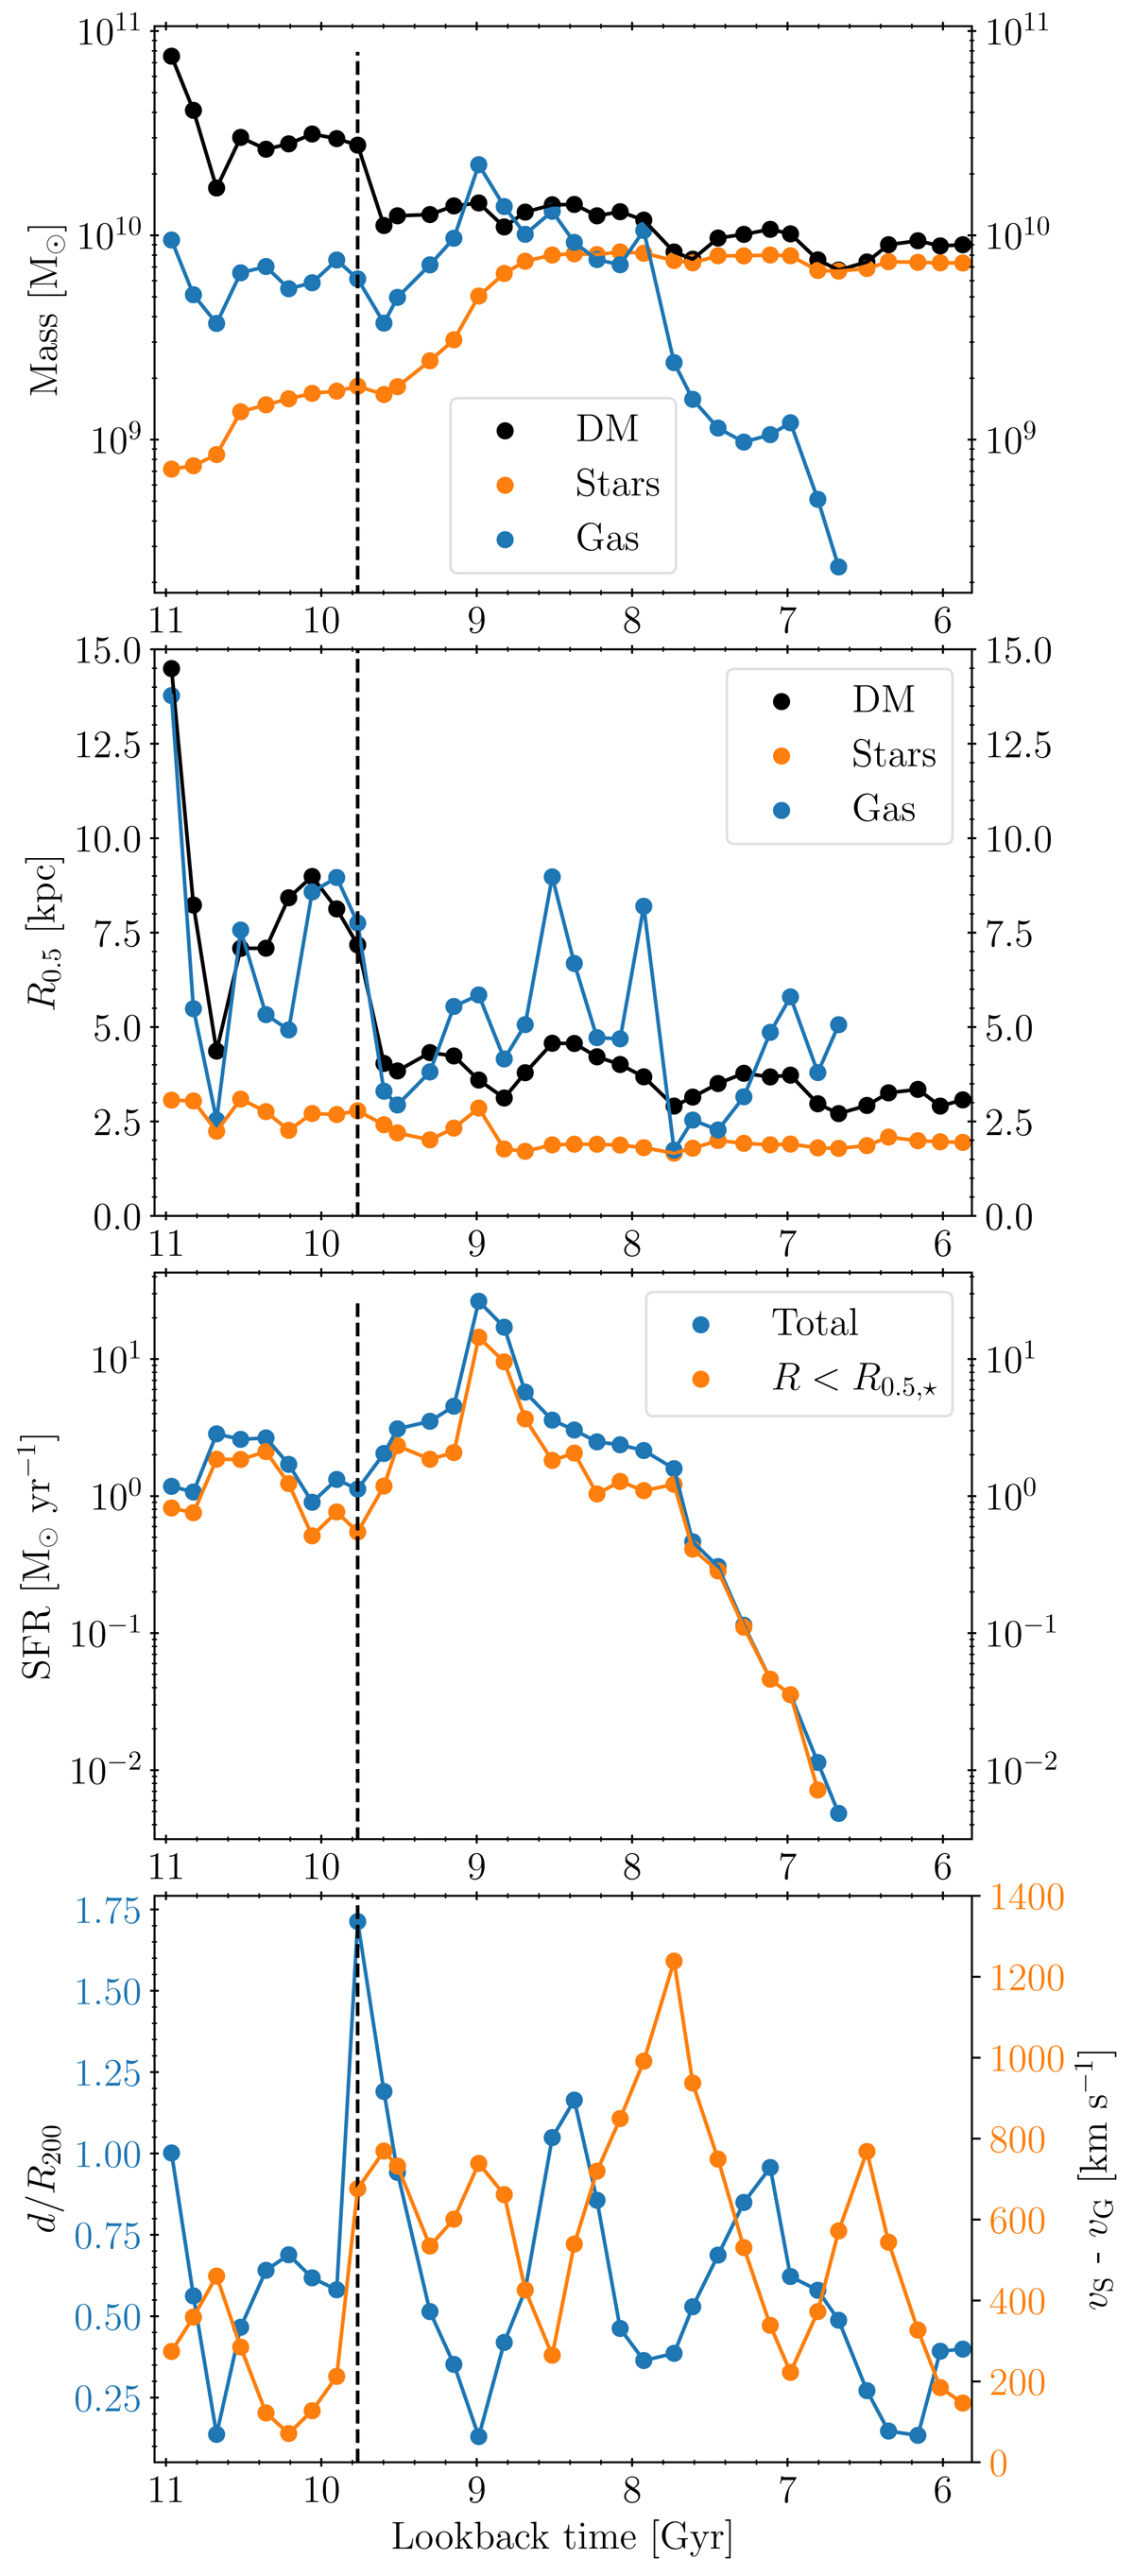
Fig. 1.
Download original image
Total mass of galactic components (dark matter, stars, gas) shown from top to bottom, with their half-mass radii, R0.5 (different colors represent different components, as per the legend); star formation rate (SFR); relative distance from the center of the group or cluster (blue, left y-axis), and the galaxy’s relative velocity (orange, right y-axis). The dashed vertical line represents the moment when the group merges with a nearby cluster.
Current usage metrics show cumulative count of Article Views (full-text article views including HTML views, PDF and ePub downloads, according to the available data) and Abstracts Views on Vision4Press platform.
Data correspond to usage on the plateform after 2015. The current usage metrics is available 48-96 hours after online publication and is updated daily on week days.
Initial download of the metrics may take a while.