Fig. 8
Download original image
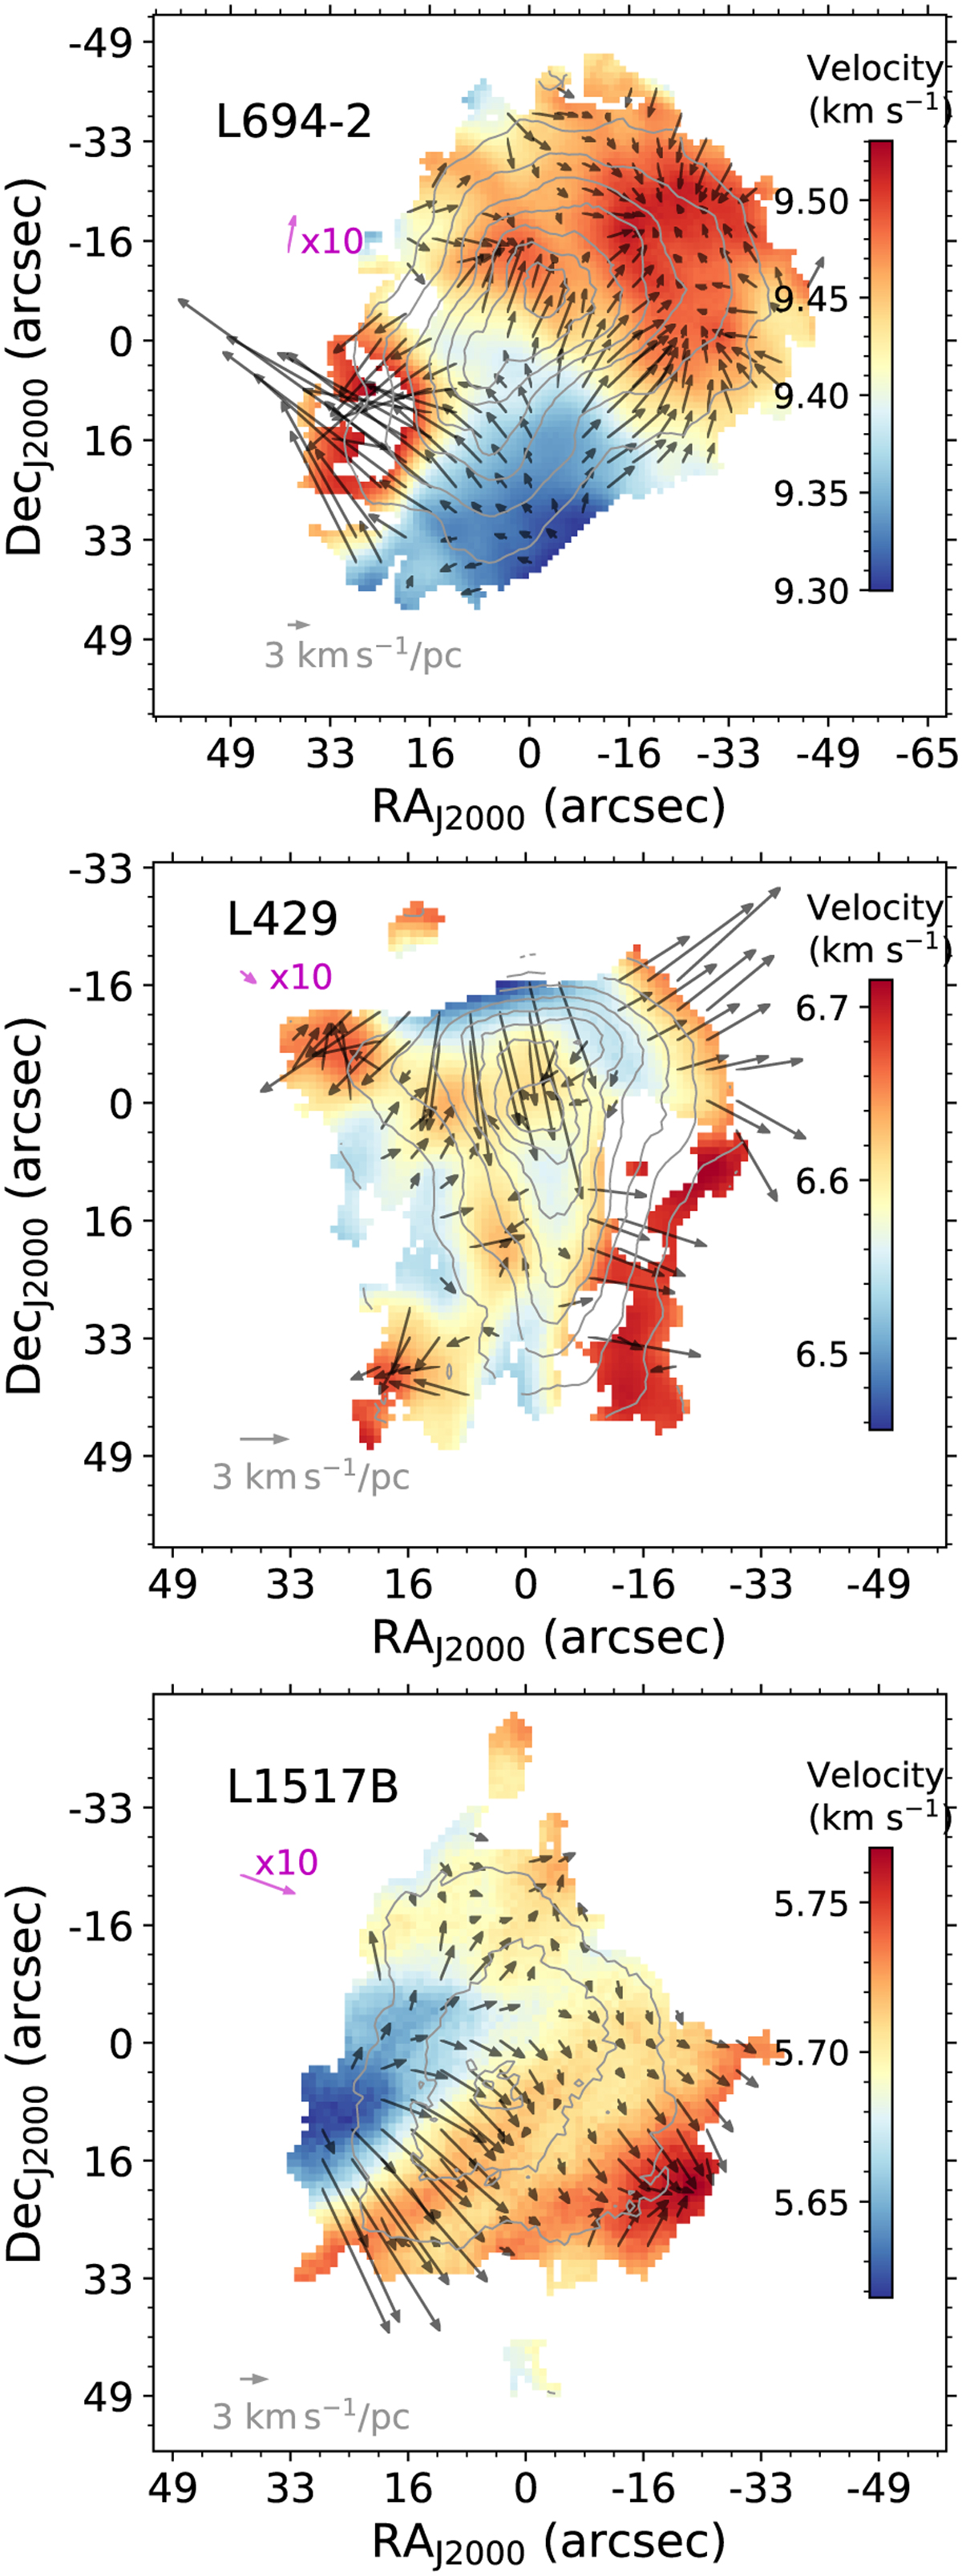
Centroid velocity map overlaid with the velocity gradient (after subtracting the average overall velocity gradient) arrows. The subregions where a second velocity component is seen are excluded from the maps. The directions of the arrows point to the steepest velocity field change in the redshifted direction, while the arrow lengths represent the relative vector magnitudes of the gradient, with the length of 3 km s−1 pc−1 indicated in each subplot. The magenta arrow shows the average overall velocity gradient across the core; the length is artificially scaled up by a factor of ten for better representation. The contour levels indicate N(NH3) starting from 1.0 × 1014 cm−2 with an interval of 2.1 × 1014 cm−2.
Current usage metrics show cumulative count of Article Views (full-text article views including HTML views, PDF and ePub downloads, according to the available data) and Abstracts Views on Vision4Press platform.
Data correspond to usage on the plateform after 2015. The current usage metrics is available 48-96 hours after online publication and is updated daily on week days.
Initial download of the metrics may take a while.