Open Access
Fig. 4
Download original image
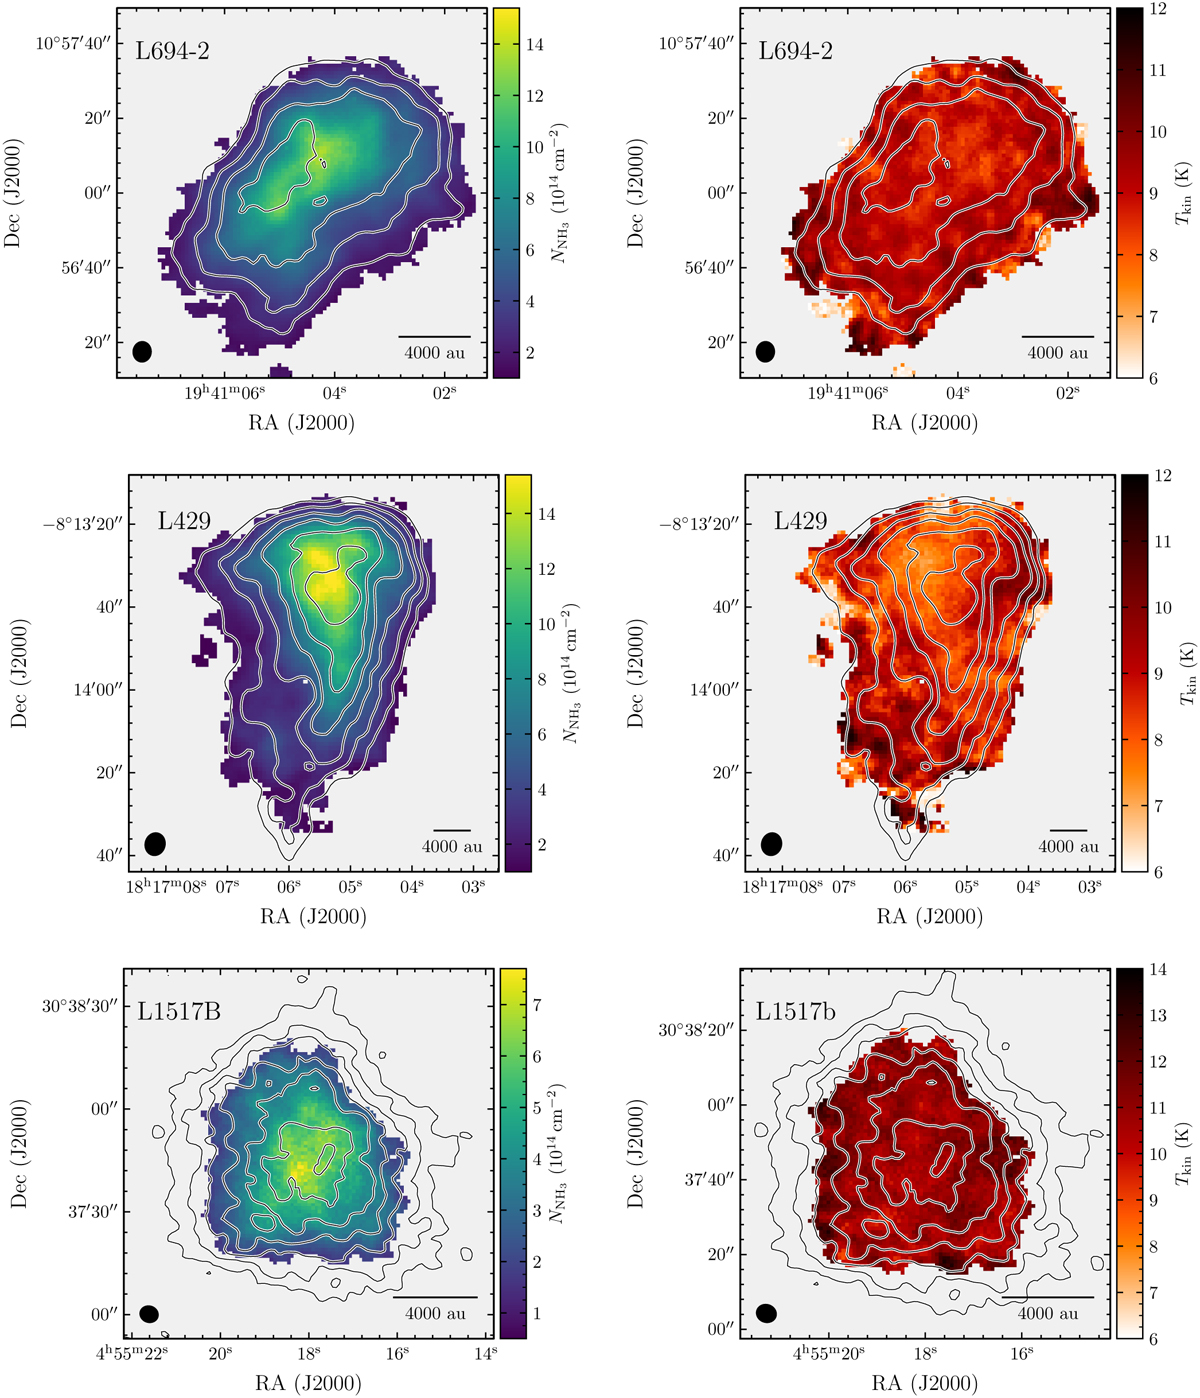
Ammonia column density, N(NH3) and kinetic temperature, Tkin maps for the three cores, constrained from one-component fit. The beam size is indicated as a black filled circle in each image. The contours are the same as that defined in Fig. 1, showing the N(H2) levels.
Current usage metrics show cumulative count of Article Views (full-text article views including HTML views, PDF and ePub downloads, according to the available data) and Abstracts Views on Vision4Press platform.
Data correspond to usage on the plateform after 2015. The current usage metrics is available 48-96 hours after online publication and is updated daily on week days.
Initial download of the metrics may take a while.