Fig. 11
Download original image
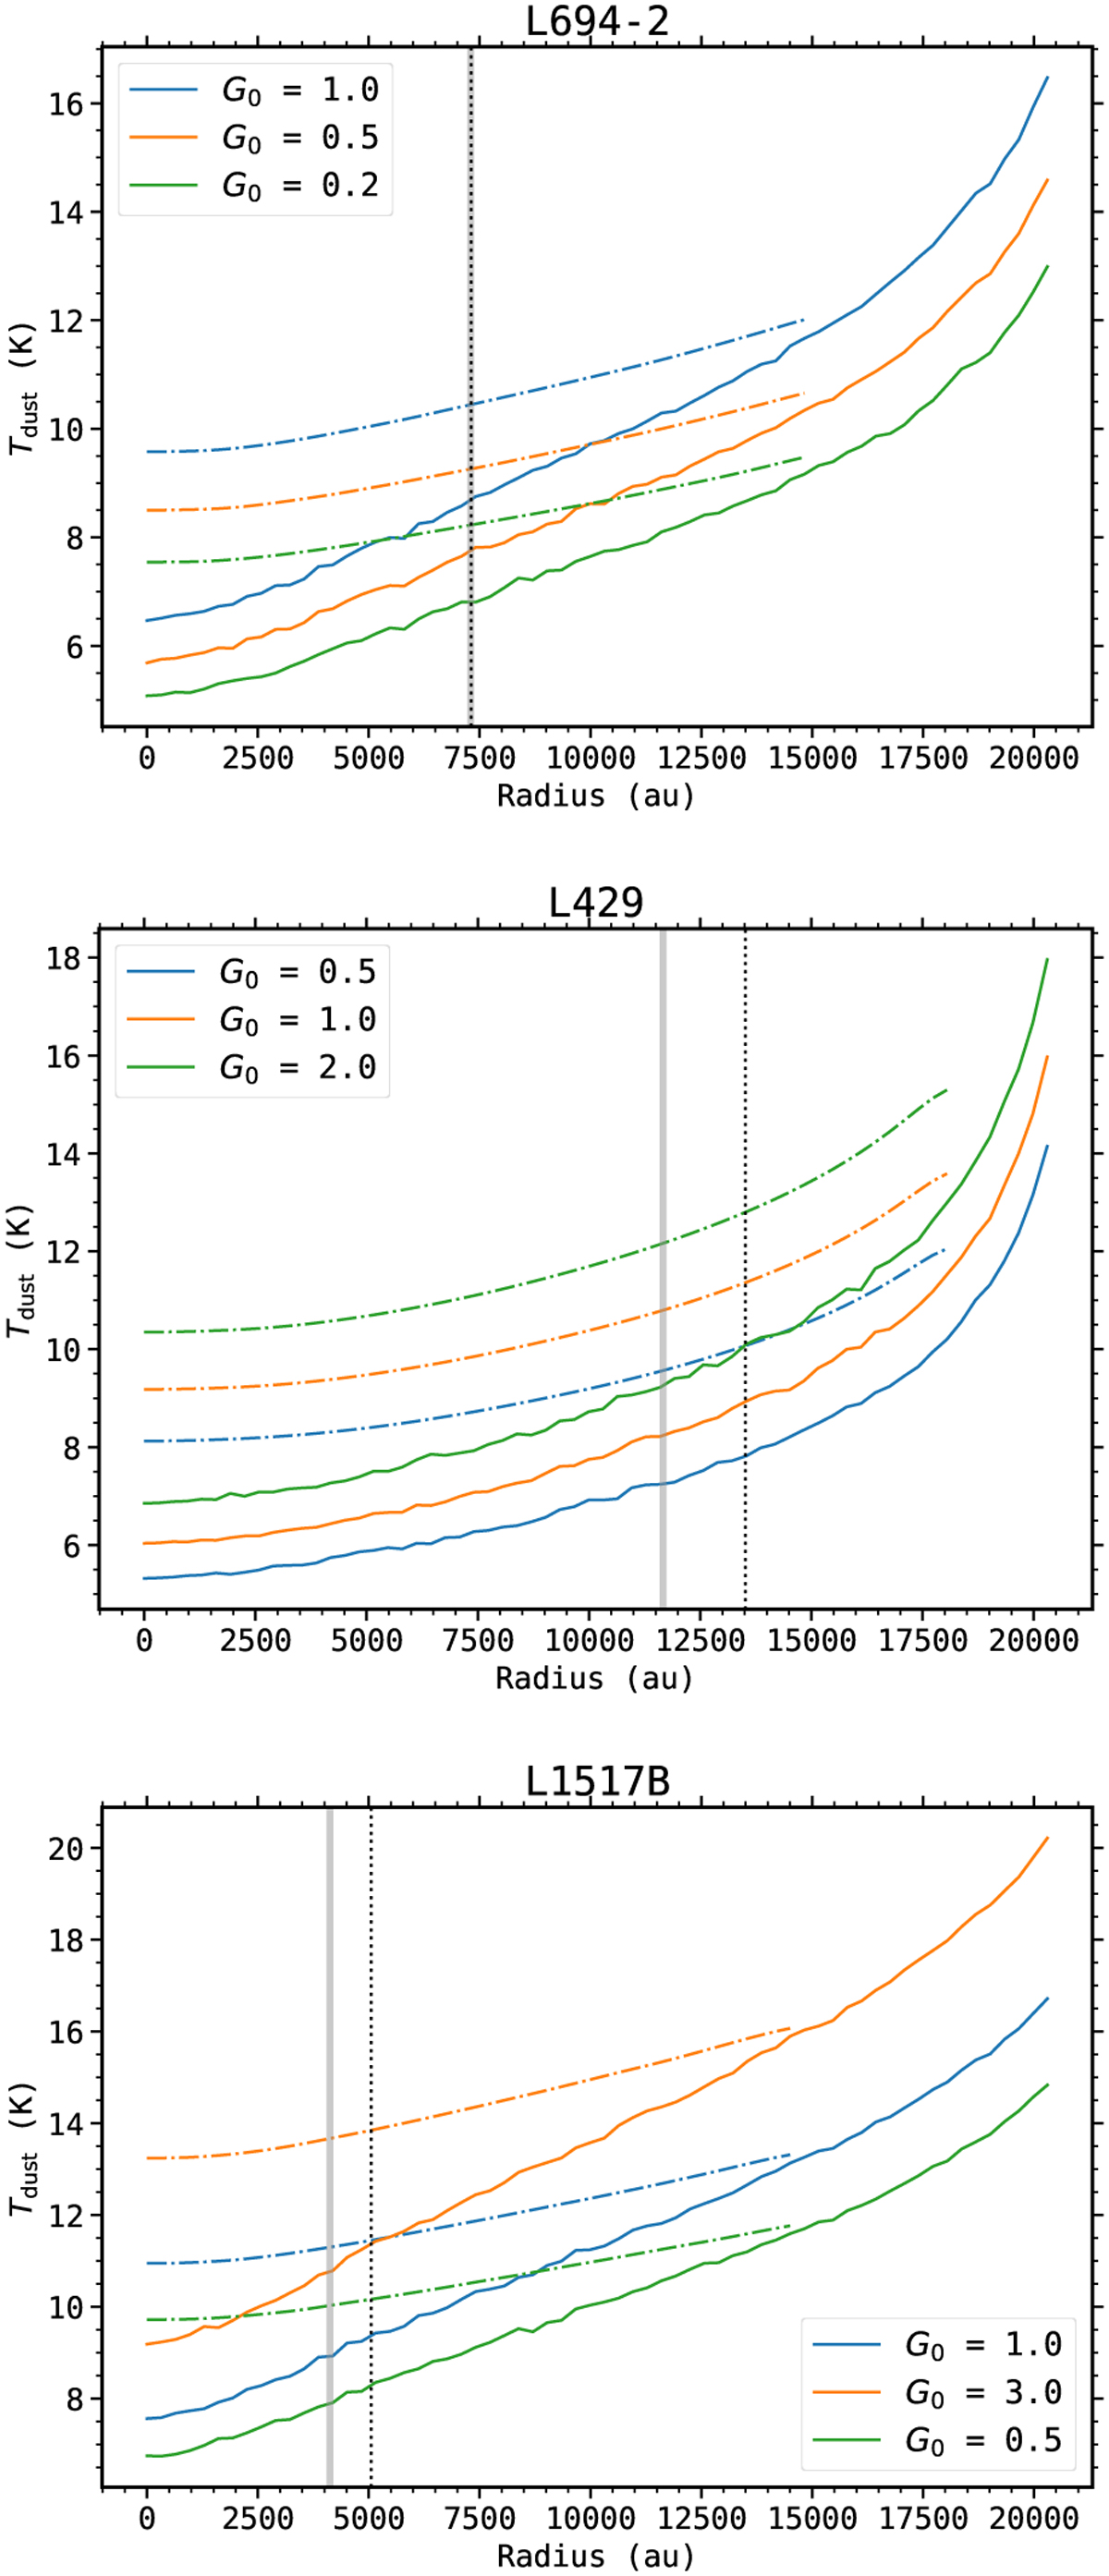
Radial temperature profiles (solid lines) calculated by RADMC-3D assuming different ISRF intensity, and the corresponding LOS mass averaged temperature profiles (dash-dotted lines). The vertical solid line in grey indicates the position within which gas density is above 105 cm−3 for each core. The vertical dotted line mark the effective radius of the obtained Tkin map from fitting the NH3 (1,1) and (2,2) lines.
Current usage metrics show cumulative count of Article Views (full-text article views including HTML views, PDF and ePub downloads, according to the available data) and Abstracts Views on Vision4Press platform.
Data correspond to usage on the plateform after 2015. The current usage metrics is available 48-96 hours after online publication and is updated daily on week days.
Initial download of the metrics may take a while.