Fig. A.1
Download original image
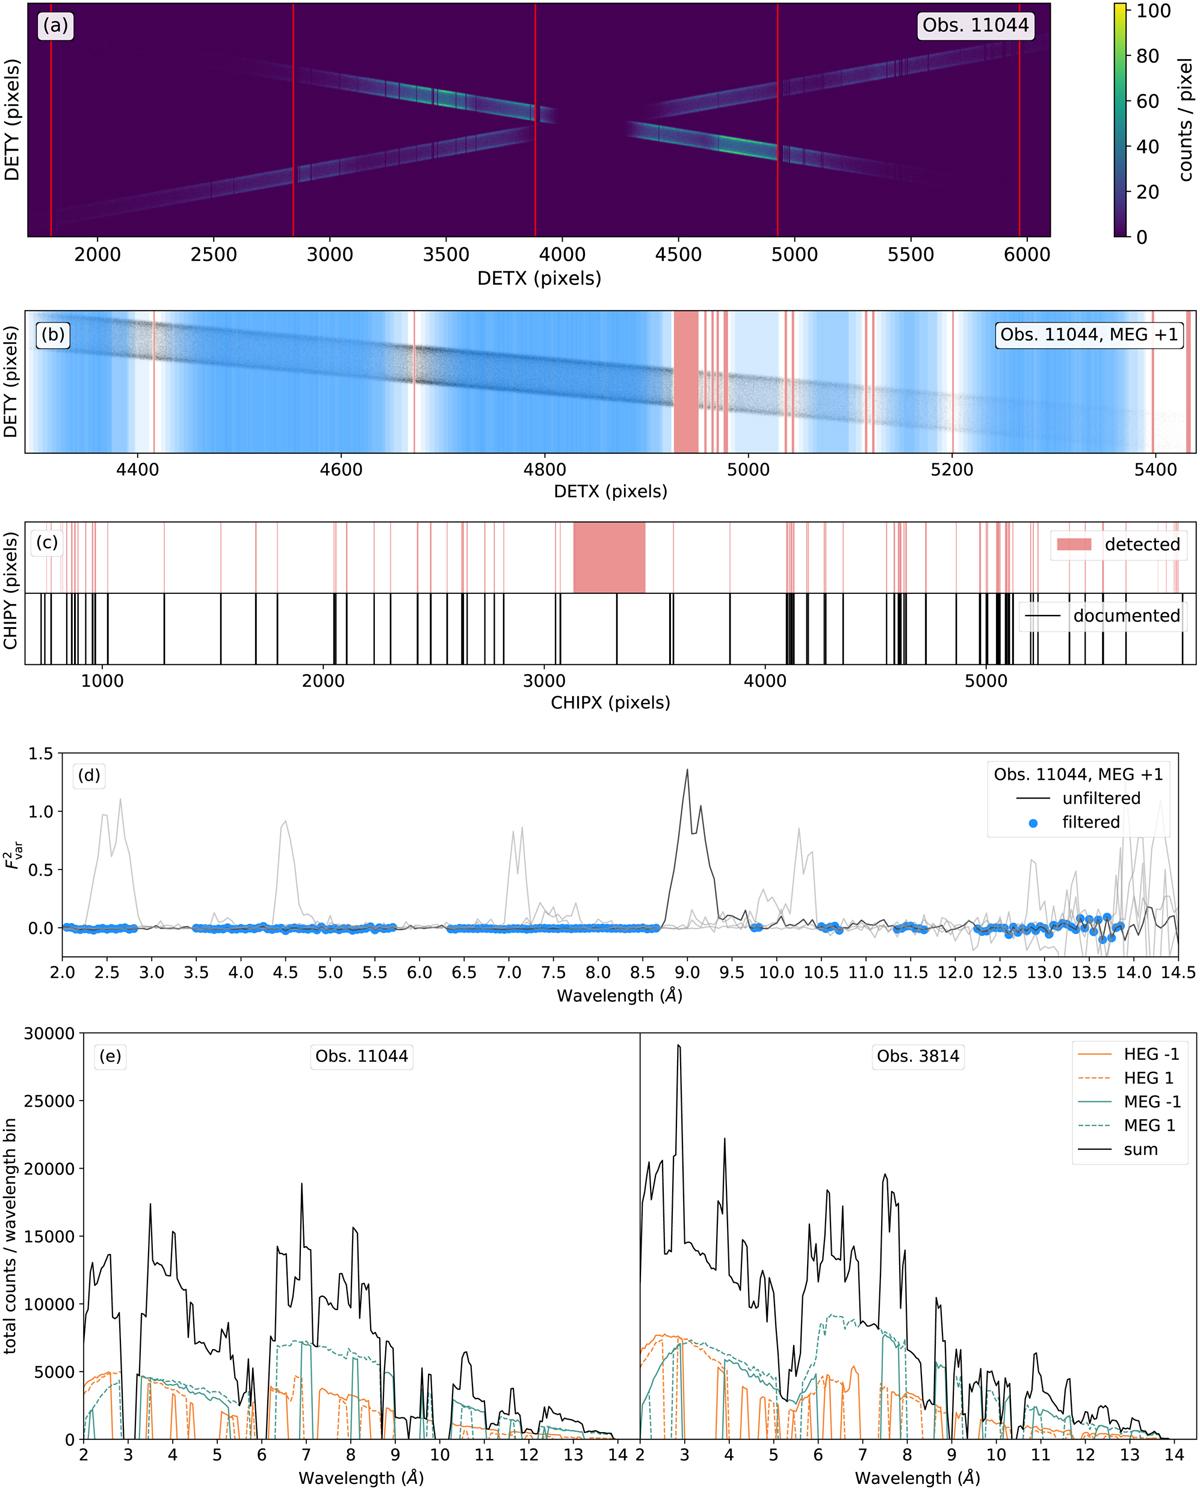
Dead pixel rows and CCD gaps in Chandra’s ACIS-S detector are a major source of systematic variance. This figure illustrates our filtering procedure. Panel (a) shows the distribution of counts on the ACIS-S CCD array, against which CCD gaps (marked in red) and dead pixel rows clearly stand out. Panel (b) shows the filtered bins (blue) and gaps (red) as an overlay on a cut-out of the top panel (first order MEG spectrum). Only bins a minimum distance of two pixels from the detected gaps pass the filtering. Panel (c) compares the positions of detected gaps to those of dead pixel rows documented in the ACIS badpix calibration file. The gap at ~3300 pixels is not excluded because of a detector defect, but because it contains zeroth-order and λ < 2 Å events. In panel (d), the resulting ![]() is shown, with the filtered bins highlighted in blue and MEG –1 and HEG ±1 spectra (all light grey) for comparison. Details on the filtering procedure can be found in the text. (e) Total counts per wavelength bin in Obs. 11044 (left) and 3814 (right) after filtering, for all gratings arms (orange and green, straight and dashed lines) and their sum (black line). For clarity, data in panels (d) and (e) are displayed with lines and no errors are given.
is shown, with the filtered bins highlighted in blue and MEG –1 and HEG ±1 spectra (all light grey) for comparison. Details on the filtering procedure can be found in the text. (e) Total counts per wavelength bin in Obs. 11044 (left) and 3814 (right) after filtering, for all gratings arms (orange and green, straight and dashed lines) and their sum (black line). For clarity, data in panels (d) and (e) are displayed with lines and no errors are given.
Current usage metrics show cumulative count of Article Views (full-text article views including HTML views, PDF and ePub downloads, according to the available data) and Abstracts Views on Vision4Press platform.
Data correspond to usage on the plateform after 2015. The current usage metrics is available 48-96 hours after online publication and is updated daily on week days.
Initial download of the metrics may take a while.