Fig. 6
Download original image
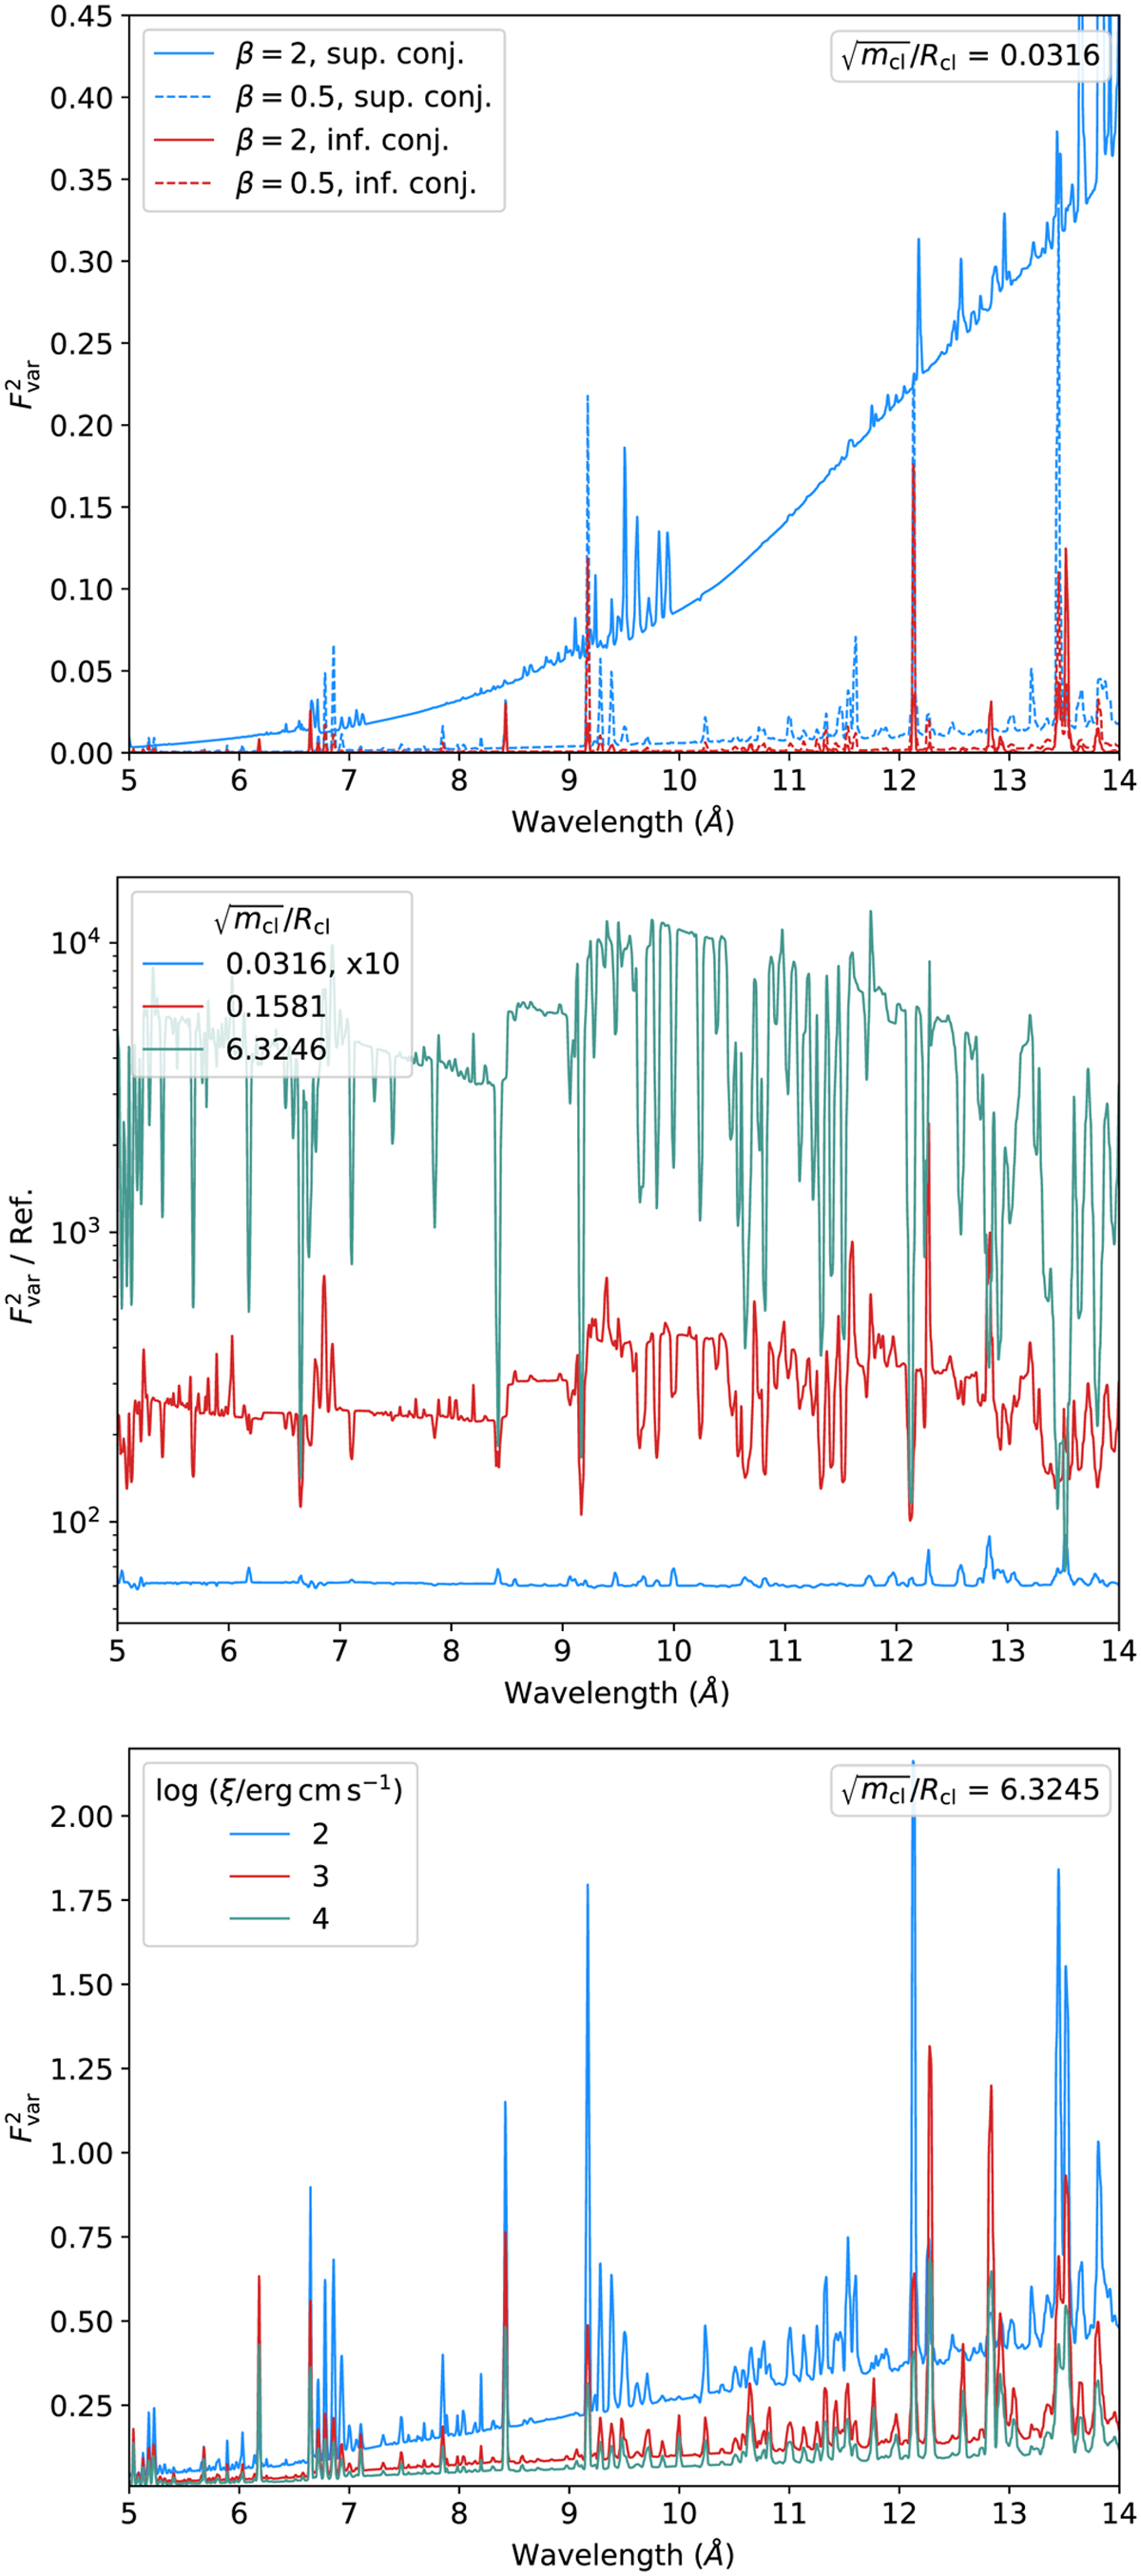
![]() expected for absorption in a clumpy wind following EG20. Details on the model generation can be found in the text. Upper panel: Dependence on the line of sight (blue: superior conjunction, red: inferior conjunction) and the β value of the wind velocity law (Eq. (6); solid: β = 2, dashed: β = 0.5), highlighting their strong impact on the continuum. Middle panel: Ratio to a baseline model with
expected for absorption in a clumpy wind following EG20. Details on the model generation can be found in the text. Upper panel: Dependence on the line of sight (blue: superior conjunction, red: inferior conjunction) and the β value of the wind velocity law (Eq. (6); solid: β = 2, dashed: β = 0.5), highlighting their strong impact on the continuum. Middle panel: Ratio to a baseline model with ![]() , showing the increase in continuum variability and with
, showing the increase in continuum variability and with ![]() and the reduced increase of the line variability (dips in the ratio). The lowest ratio model (blue) has been multiplied by a factor of ten for better visibility. Bottom panel: Ionisation dependence. A high
and the reduced increase of the line variability (dips in the ratio). The lowest ratio model (blue) has been multiplied by a factor of ten for better visibility. Bottom panel: Ionisation dependence. A high ![]() is shown to highlight the continuum changes. The increase in
is shown to highlight the continuum changes. The increase in ![]() with ionisation is weaker for higher ionisations. For clarity, the model is only shown above 5 Å.
with ionisation is weaker for higher ionisations. For clarity, the model is only shown above 5 Å.
Current usage metrics show cumulative count of Article Views (full-text article views including HTML views, PDF and ePub downloads, according to the available data) and Abstracts Views on Vision4Press platform.
Data correspond to usage on the plateform after 2015. The current usage metrics is available 48-96 hours after online publication and is updated daily on week days.
Initial download of the metrics may take a while.