Fig. 5
Download original image
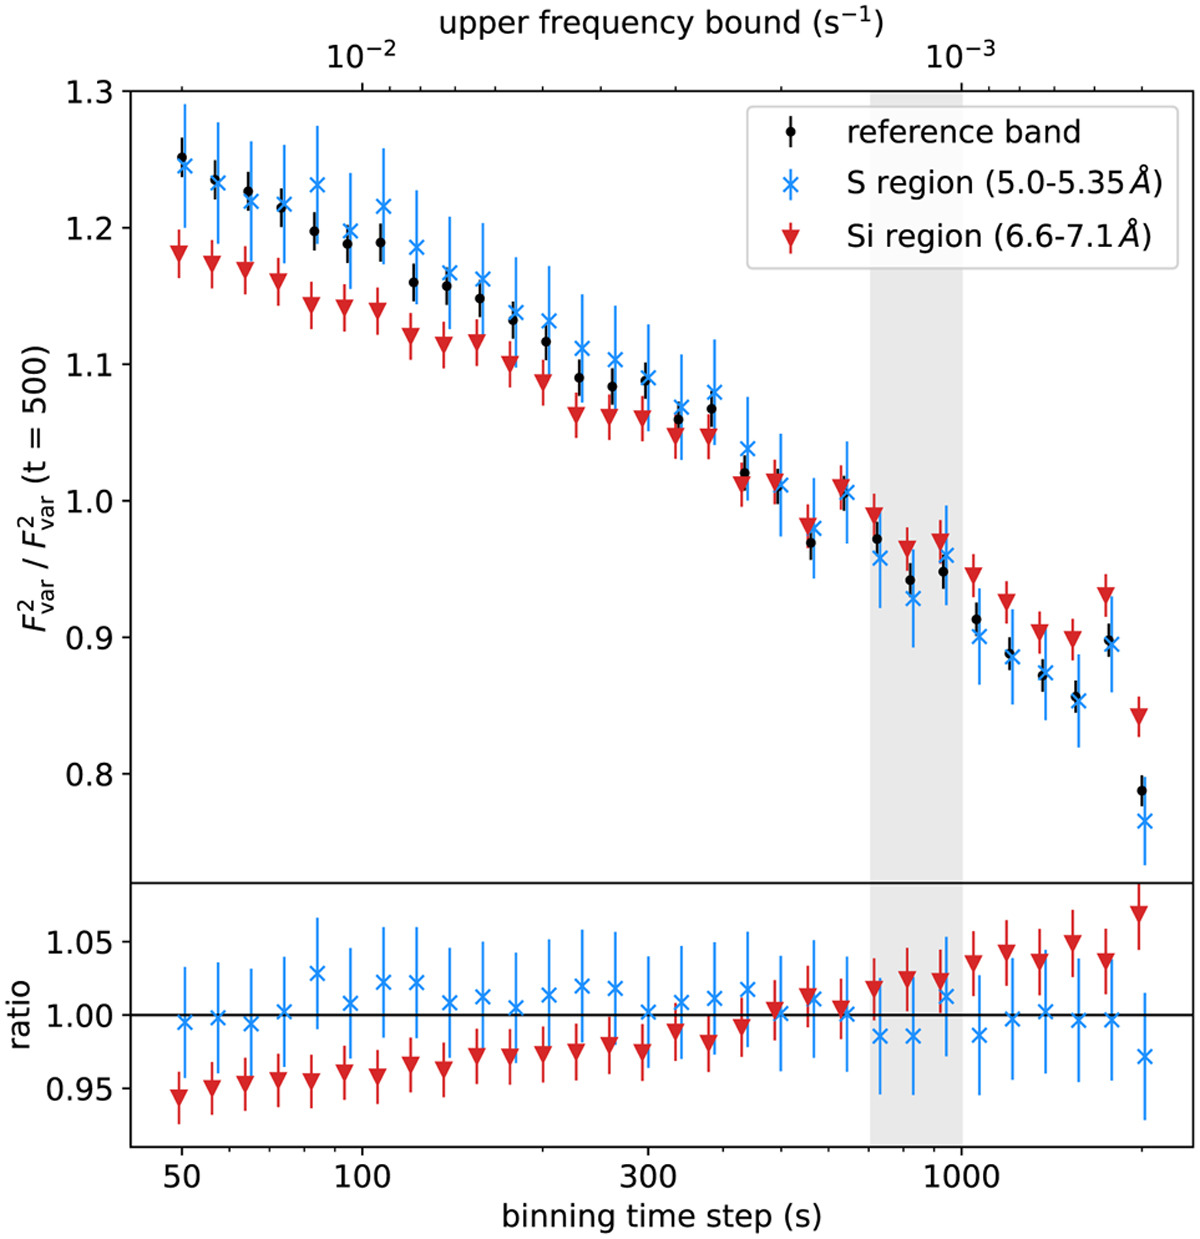
Total variability in Obs. 3814 in terms of ![]() as a function of the binning time step; in other words, the figure effectively shows integrated frequency power. The sulphur (blue, 5–5.35 Å) and silicon (red, 6.6–7.2 Å) line regions are compared to a reference band (black, 5.4–6.6 Å, excluding a region of ±0.05 Å around the Sixiv line), with the ratio shown in the bottom panel.
as a function of the binning time step; in other words, the figure effectively shows integrated frequency power. The sulphur (blue, 5–5.35 Å) and silicon (red, 6.6–7.2 Å) line regions are compared to a reference band (black, 5.4–6.6 Å, excluding a region of ±0.05 Å around the Sixiv line), with the ratio shown in the bottom panel. ![]() is normalised to its value at 500 s in each respective band. The light grey band indicates a range where systematic effects due to the dither of the telescope would arise, if they were present.
is normalised to its value at 500 s in each respective band. The light grey band indicates a range where systematic effects due to the dither of the telescope would arise, if they were present.
Current usage metrics show cumulative count of Article Views (full-text article views including HTML views, PDF and ePub downloads, according to the available data) and Abstracts Views on Vision4Press platform.
Data correspond to usage on the plateform after 2015. The current usage metrics is available 48-96 hours after online publication and is updated daily on week days.
Initial download of the metrics may take a while.