Fig. 3
Download original image
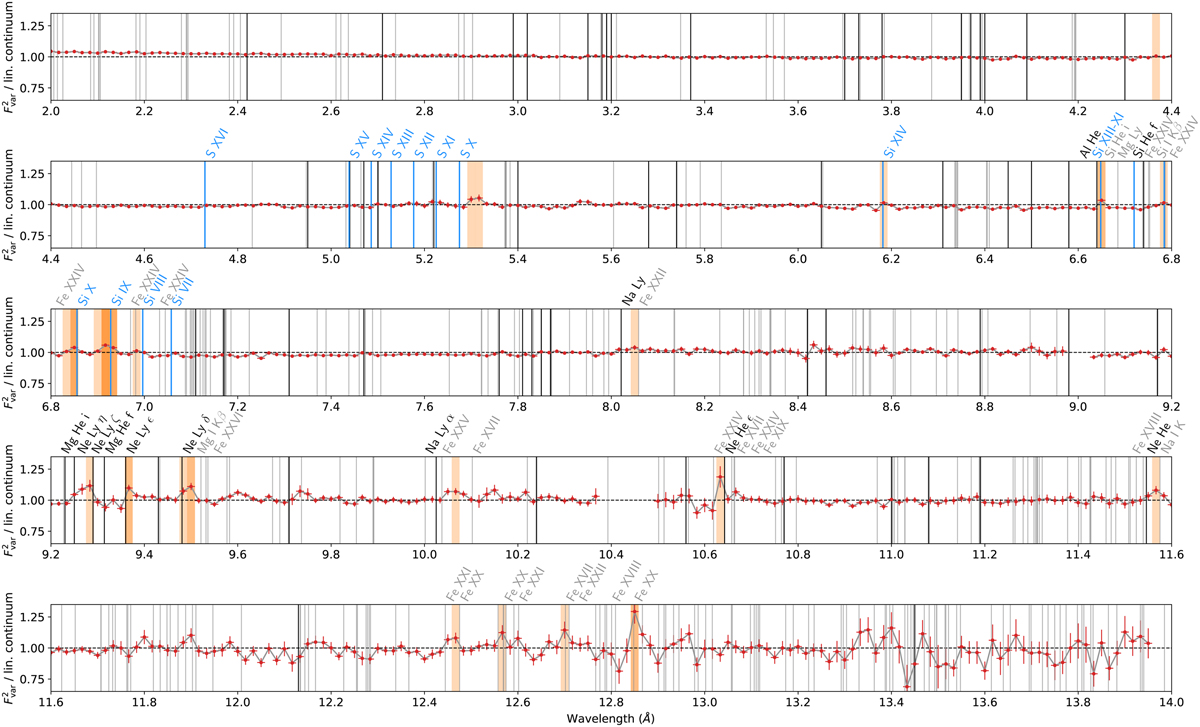
![]() spectrum of Obs. 3814, relative to the continuum fit from Fig. 2. Three sets of lines are shown: H and He-like absorption lines identified by Hanke et al. (2009, black), S and Si lines from Hirsch et al. (2019, blue), transitions from the selection described in Sect. 3.4 (grey), which includes iron. Spikes with a significance of σ > 2σ are highlighted in shades of orange according to the value of σ. Lines marked in black and grey are labelled only if they are close (<0.05 Å) to a significant spike. For subsequent iron transitions belonging to the same ion, the label is shown only once. A list of spikes and associated transitions can be found in Table 1.
spectrum of Obs. 3814, relative to the continuum fit from Fig. 2. Three sets of lines are shown: H and He-like absorption lines identified by Hanke et al. (2009, black), S and Si lines from Hirsch et al. (2019, blue), transitions from the selection described in Sect. 3.4 (grey), which includes iron. Spikes with a significance of σ > 2σ are highlighted in shades of orange according to the value of σ. Lines marked in black and grey are labelled only if they are close (<0.05 Å) to a significant spike. For subsequent iron transitions belonging to the same ion, the label is shown only once. A list of spikes and associated transitions can be found in Table 1.
Current usage metrics show cumulative count of Article Views (full-text article views including HTML views, PDF and ePub downloads, according to the available data) and Abstracts Views on Vision4Press platform.
Data correspond to usage on the plateform after 2015. The current usage metrics is available 48-96 hours after online publication and is updated daily on week days.
Initial download of the metrics may take a while.