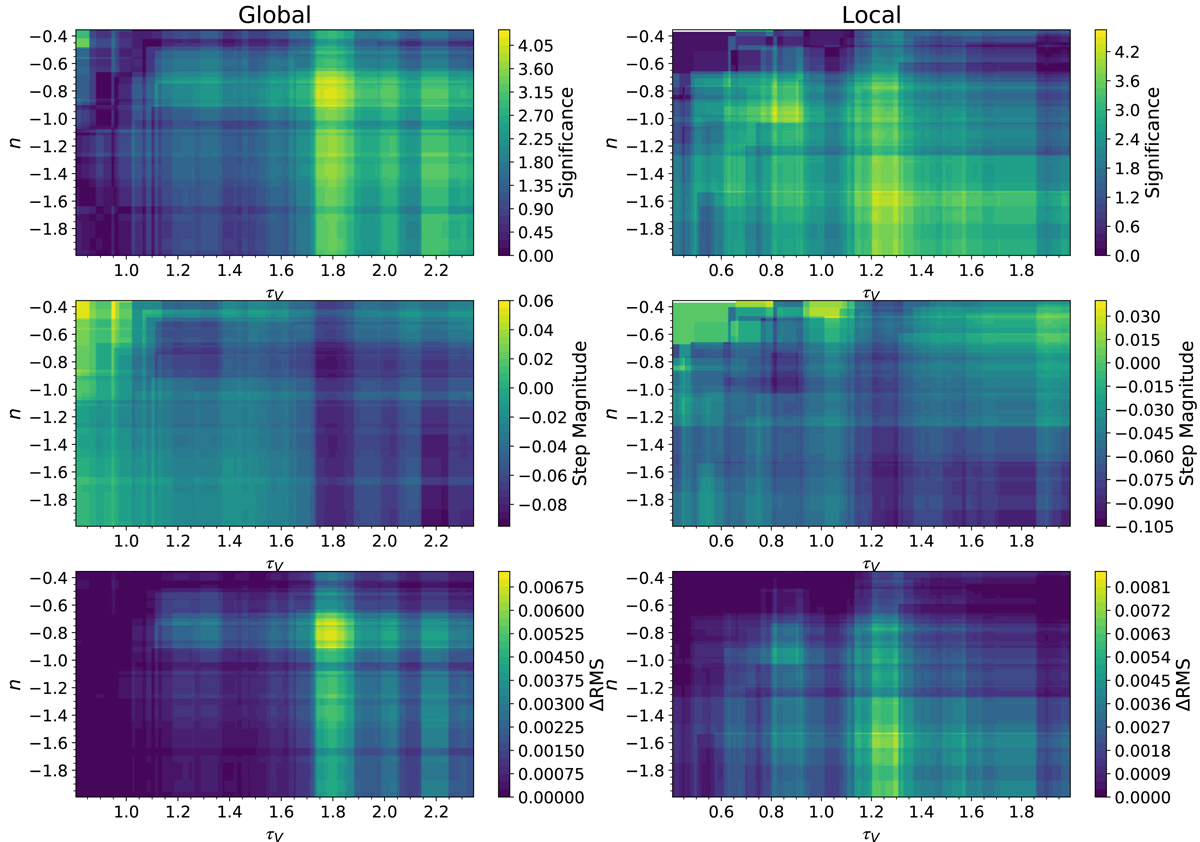
Fig. 9.
Download original image
Variation of the Second Split dust step with the step location (position in τV − n grid) for the Tripp standardization. Results from global measurements are shown on the left, while those from local measurements are shown on the right. The top panel shows the significance of the step in σ, the middle panel shows the magnitude of the step and the lower panel shows ΔRMS. This last quantity is defined as the difference between the RMSsingle obtained for a single population mean description and the RMSdual obtained for a dual population mean description with a step.
Current usage metrics show cumulative count of Article Views (full-text article views including HTML views, PDF and ePub downloads, according to the available data) and Abstracts Views on Vision4Press platform.
Data correspond to usage on the plateform after 2015. The current usage metrics is available 48-96 hours after online publication and is updated daily on week days.
Initial download of the metrics may take a while.