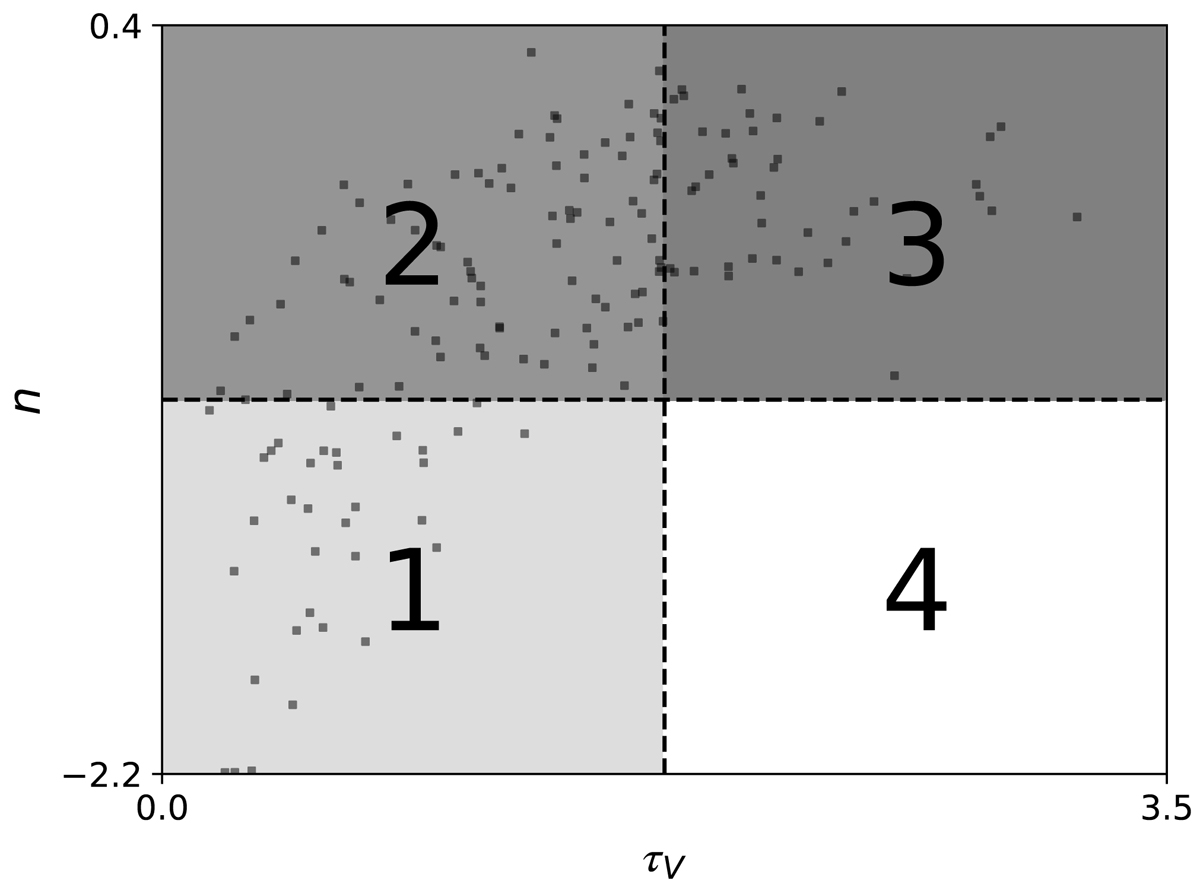
Fig. 8.
Download original image
Schematic representations of the regions singled out by each of the proposed dust-step splits in the τV − n parameter space. The best-fit values of n as a function of τV for the fitted DES galaxies with global griz photometry are shown for reference. The dashed lines only represent possible division points for the populations, with the actual optimal values recorded in in Table 6.
Current usage metrics show cumulative count of Article Views (full-text article views including HTML views, PDF and ePub downloads, according to the available data) and Abstracts Views on Vision4Press platform.
Data correspond to usage on the plateform after 2015. The current usage metrics is available 48-96 hours after online publication and is updated daily on week days.
Initial download of the metrics may take a while.