Fig. 7.
Download original image
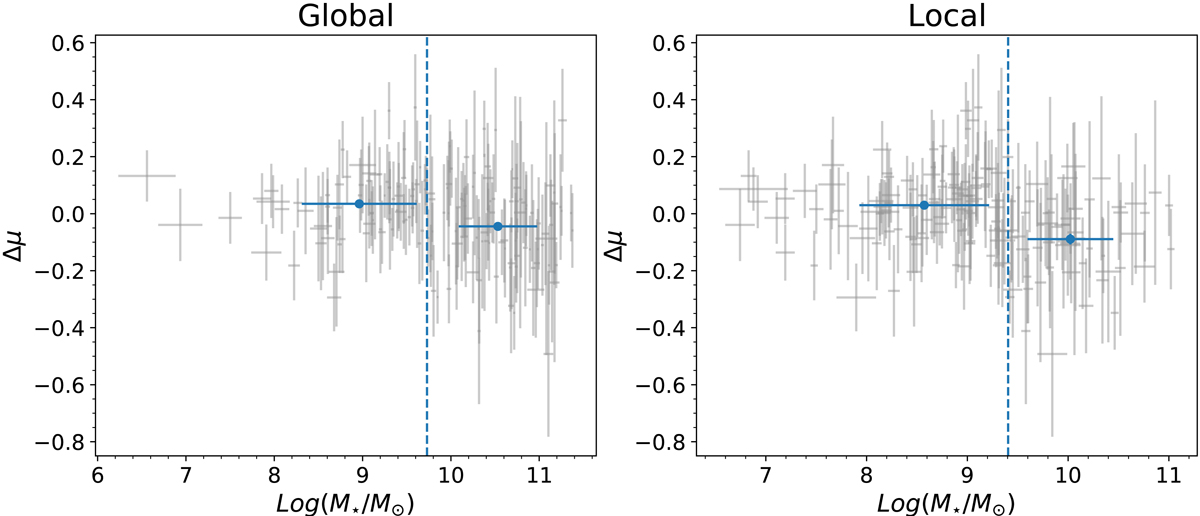
Hubble residuals Δμ for the DES SNe Ia as a function of the stellar mass for the respective host galaxies, plotted in gray. The optimal step locations, as recorded in Table 5 are shown in dashed blue. The blue dots show the mean values of log(M⋆/M⊙) and Δμ in each bin, with the error in the x-axis given by the standard deviation.
Current usage metrics show cumulative count of Article Views (full-text article views including HTML views, PDF and ePub downloads, according to the available data) and Abstracts Views on Vision4Press platform.
Data correspond to usage on the plateform after 2015. The current usage metrics is available 48-96 hours after online publication and is updated daily on week days.
Initial download of the metrics may take a while.