Fig. 6.
Download original image
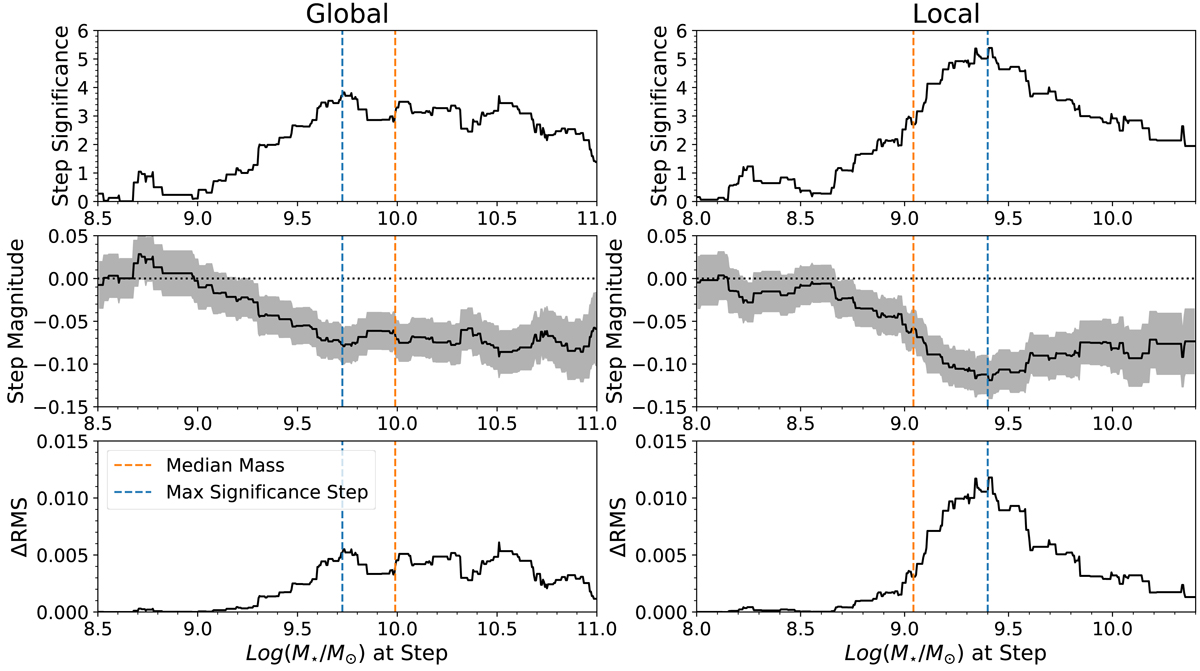
Variation of the mass step with step location for the Tripp standardization, for the global (left panels) and the local (right panels) cases. The top panel shows the significance of the step in σ, the middle panel shows the magnitude of the step in solid black, with the gray region showing the uncertainty, and the lower panel shows ΔRMS. In these three panels, the location of the step of maximum significance is shown in blue and the median mass of the sample is shown in orange. Inspired by Kelsey et al. (2021).
Current usage metrics show cumulative count of Article Views (full-text article views including HTML views, PDF and ePub downloads, according to the available data) and Abstracts Views on Vision4Press platform.
Data correspond to usage on the plateform after 2015. The current usage metrics is available 48-96 hours after online publication and is updated daily on week days.
Initial download of the metrics may take a while.