Fig. 5.
Download original image
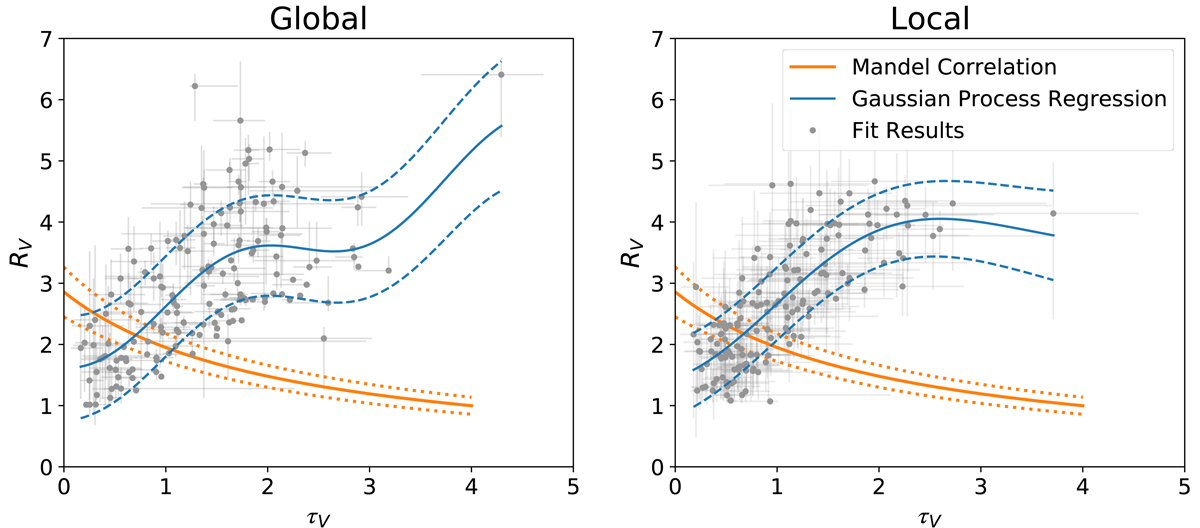
Best-fit values of RV as a function of τV for the fitted DES galaxies with DECam Global (left panel) and Local (right panel) griz photometry. Results for the different galaxies are shown in gray. A Gaussian Process Regression is shown in solid blue, with dashed blue lines defining a 68% credible interval. The correlation found by Mandel et al. (2011) between these two quantities for the extinction laws of a set of nearby SNe Ia is shown in orange.
Current usage metrics show cumulative count of Article Views (full-text article views including HTML views, PDF and ePub downloads, according to the available data) and Abstracts Views on Vision4Press platform.
Data correspond to usage on the plateform after 2015. The current usage metrics is available 48-96 hours after online publication and is updated daily on week days.
Initial download of the metrics may take a while.