Fig. 4.
Download original image
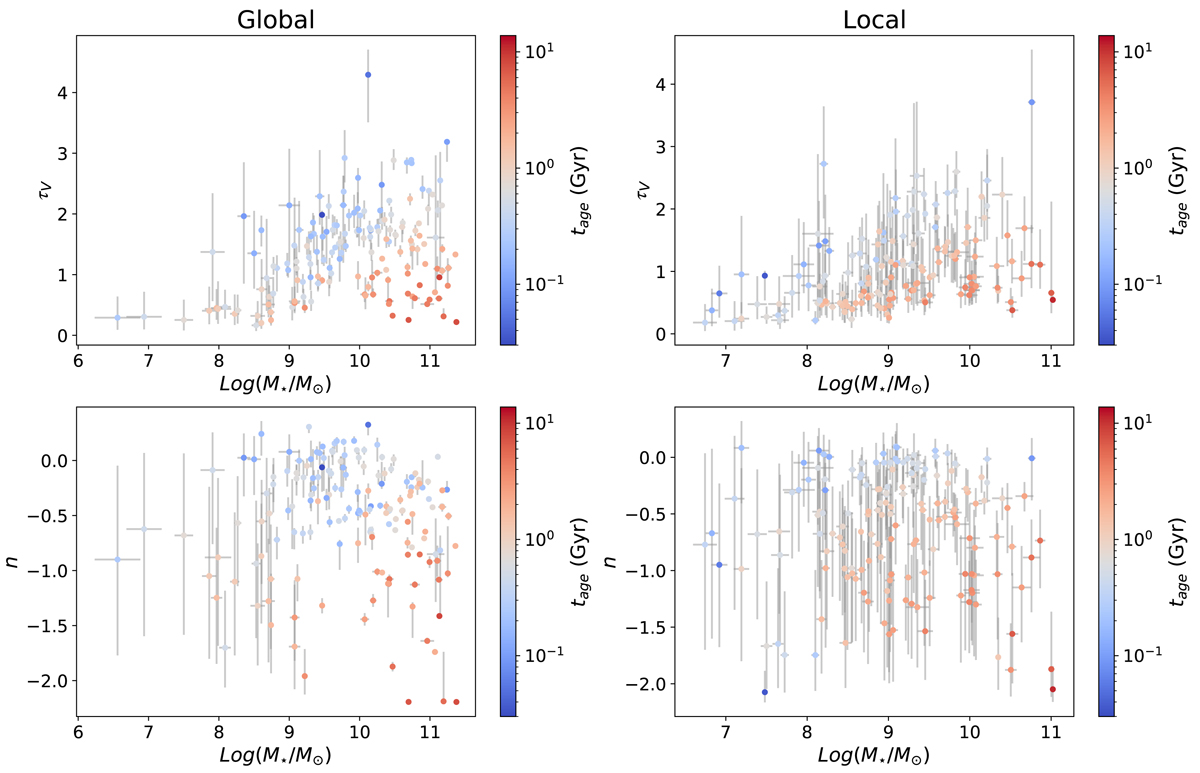
Best-fit results for the dust parameters as a function of log(M⋆/M⊙) for the fitted DES galaxies with DECam global (left panels) and local (right panels) griz photometry. Plots for τV are shown in the top row, while results for n are shown in the bottom row. The best-fit for the age of each galaxy is plotted on a gradient from blue (younger) to red (older).
Current usage metrics show cumulative count of Article Views (full-text article views including HTML views, PDF and ePub downloads, according to the available data) and Abstracts Views on Vision4Press platform.
Data correspond to usage on the plateform after 2015. The current usage metrics is available 48-96 hours after online publication and is updated daily on week days.
Initial download of the metrics may take a while.