Fig. D.1.
Download original image
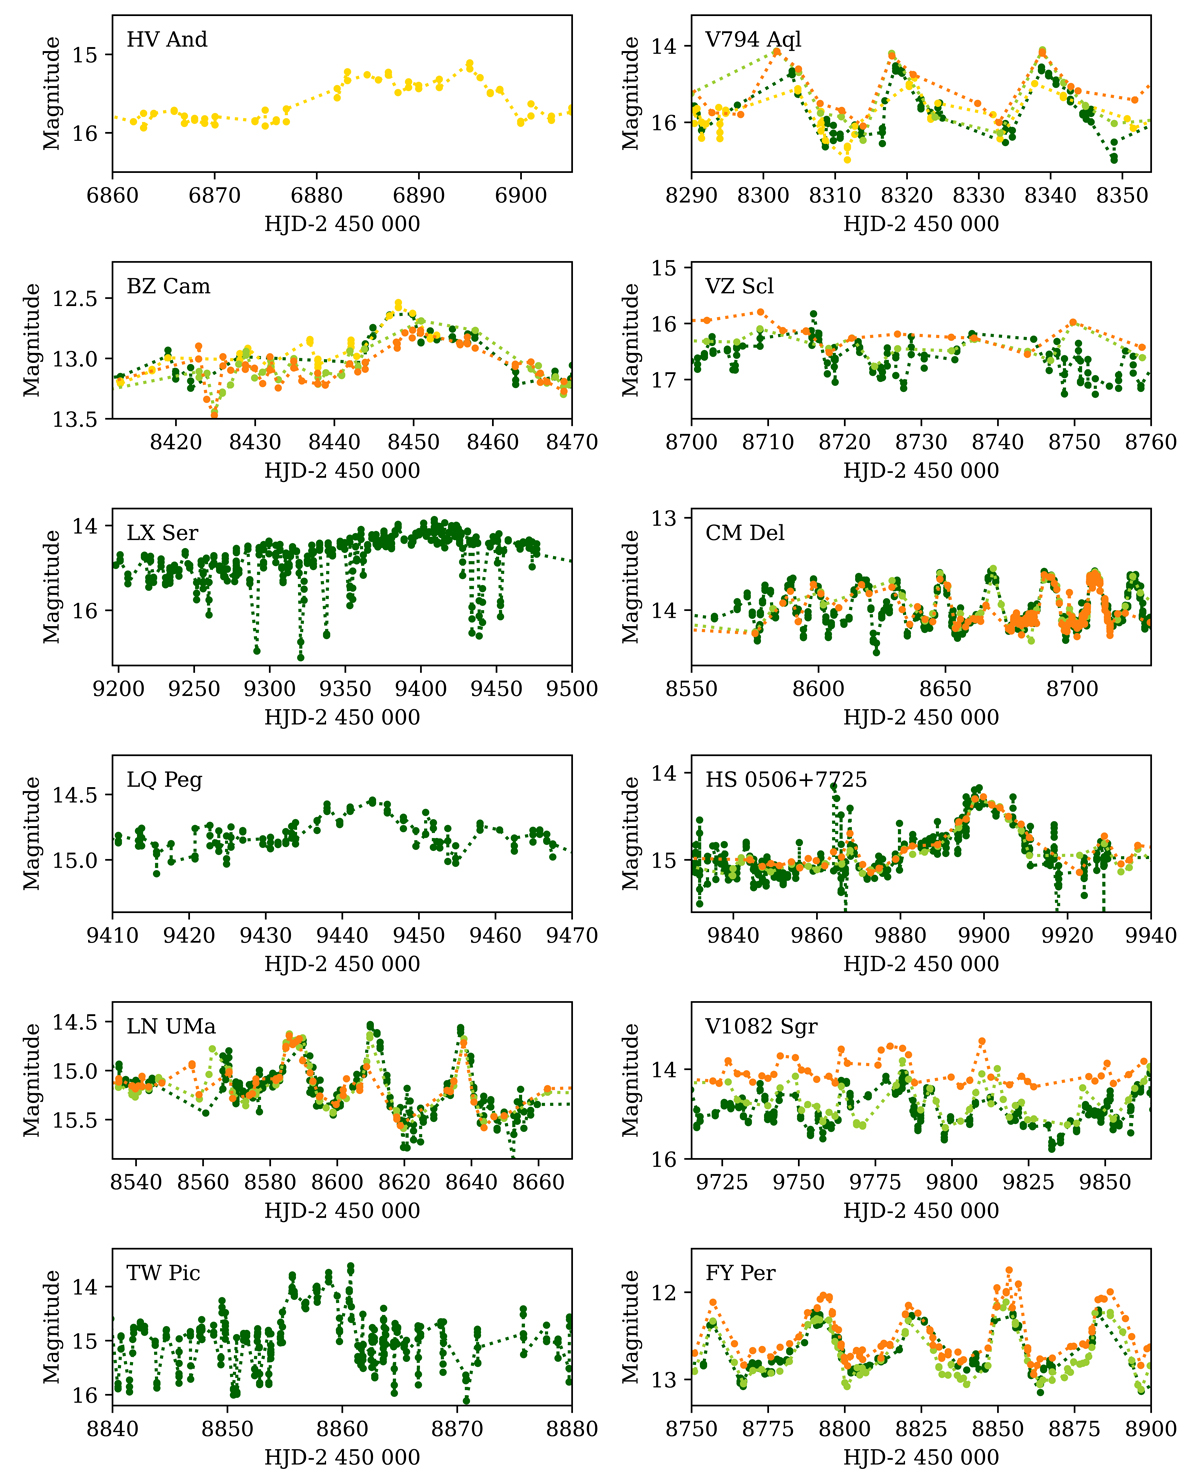
Excerpts of the optical light curves of a few VY Scl-type nova-like variables. The yellow and the dark green symbols show the ASAS-SN V and g band observations, respectively, and the orange and the light green filled circles indicate the ZTF r and g band observations. The names of the systems are displayed in the top left corner of each panel.
Current usage metrics show cumulative count of Article Views (full-text article views including HTML views, PDF and ePub downloads, according to the available data) and Abstracts Views on Vision4Press platform.
Data correspond to usage on the plateform after 2015. The current usage metrics is available 48-96 hours after online publication and is updated daily on week days.
Initial download of the metrics may take a while.